
Figure 4.
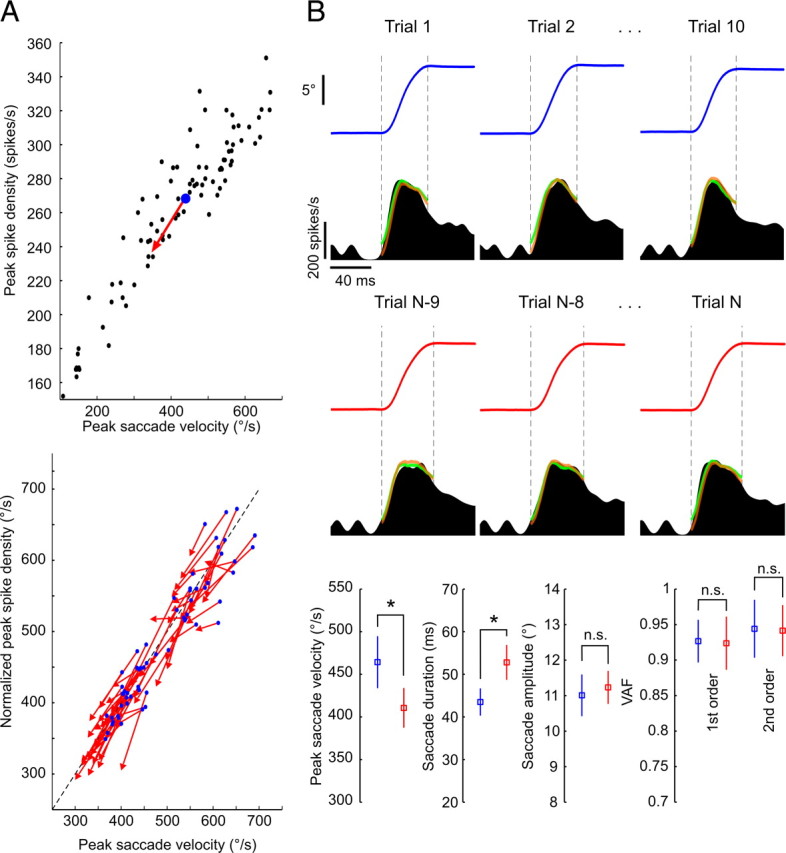
No changes in eye plant dynamics occur during the course of fatigue. A, Progressively slower eye saccades are accompanied by parallel decreases in peak discharges of abducens neurons. Top, Average data points at fatigue start (blue dots) and end (red arrowheads) with pre-fatigue peak discharges plotted against saccade peak velocity (black dots) for one example neuron. Bottom, Same average data points for all 62 neurons normalized to the unity-slope line (dotted line) with their respective pre-fatigue velocity sensitivity regression fits [Yn = (Y − b)/a, where Yn is the normalized version of the peak spike density measure Y, and a and b are, respectively, the slope and y-intercept of the velocity sensitivity regression line]. B, The evaluated models predicted the activity of abducens neurons equally well throughout fatigue. Top, Eye traces and corresponding abducens neuron spike density functions of an example neuron, with superimposed first (green)- and second (orange)-order model fits, for three trials taken from the start (blue) and end (red) of a fatigue experiment. Bottom, Between the start (blue) and end (red) of the fatigue, mean (±SD) values of peak saccade velocity and duration showed significant changes (*) (t tests, p = 0.0004 and p = 0.00003, respectively), whereas those of saccade amplitude (p = 0.36) and the VAF by the first (p = 0.85)- and second (p = 0.88)-order model fits did not (n.s.).