
Figure 10.
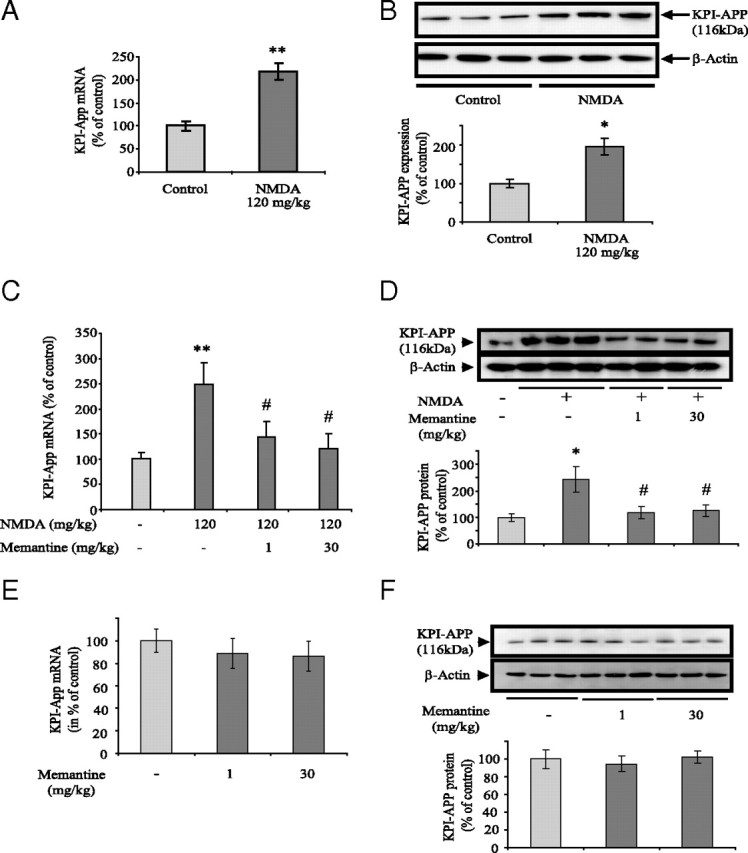
Memantine at low or high doses inhibits the increase in KPI-APP expression in cortex of mice injected intraperitoneally with NMDA. Swiss mice received an intraperitoneal injection of saline vehicle or memantine (1 or 30 mg/kg). Thirty minutes after this first injection, animals received a second intraperitoneal injection of PBS, pH 7.4, or NMDA in a dose of 120 mg/kg. Mice were exposed to this treatment for 6 h (for RNA extraction) or 24 h (for protein extraction). A, Real-time PCR analysis of KPI-APP mRNA expression in cortical tissue of mice injected with 120 mg/kg NMDA. Total RNA was isolated from cortices by acidic phenol/chloroform extraction before to be reverse transcribed in cDNA. The expression level of APP was analyzed according to the ΔΔCt method with cyclophilin as the housekeeping gene. Results are representative of six independent experiments. Statistical analysis was realized by ANOVA followed by Bonferroni-Dunn's test (n = 6; **p < 0.01 vs control). B, Immunoblotting analysis of KPI-APP protein expression in cortical tissue of mice injected or not with 120 mg/kg NMDA. Blots were rehybridized with an anti-actin antibody to estimate the total amount of proteins loaded. Relative expression of KPI-APP compared with actin is presented in histogram below the blot. Each column is the mean ± SD from six immunoblots (n = 6). Statistical analysis was realized by ANOVA followed by Bonferroni–Dunn's test (n = 6; *p < 0.05 vs control). C, Real-time PCR analysis of KPI-APP mRNA expression in cortical tissue of mice 6 h after 120 mg/kg NMDA injection, with or without memantine (1 or 30 mg/kg). (n = 6; **p < 0.01 vs control; # p < 0.05 vs NMDA alone). D, Immunoblotting analysis of KPI-APP protein expression in cortical tissue of NMDA-injected mice with or without memantine (1 or 30 mg/kg). Relative expression of KPI-APP normalized with actin is presented in histogram below the blot. Each column is the mean ± SD from six immunoblots (n = 6). Statistical analysis was realized by ANOVA followed by Bonferroni–Dunn's test (n = 6; *p < 0.05 vs control; #p < 0.05 vs NMDA alone). E, Real-time PCR analysis of KPI-APP mRNA expression in cortical tissue of mice 6 h after injection of saline or memantine alone (1 or 30 mg/kg). F, Top, Immunoblotting analysis of KPI-APP protein expression in cortical tissue of mice 24 h after injection of saline or memantine alone (1 or 30 mg/kg). Blots were rehybridized with an anti-actin antibody to estimate the total amount of proteins loaded. Bottom, Relative quantification of KPI-APP protein expression compared with actin from experiments presented above. Densitometric analysis of the protein bands was performed with ImageJ software. Each column is the mean ± SD from three immunoblots (n = 3).