
Figure 2.
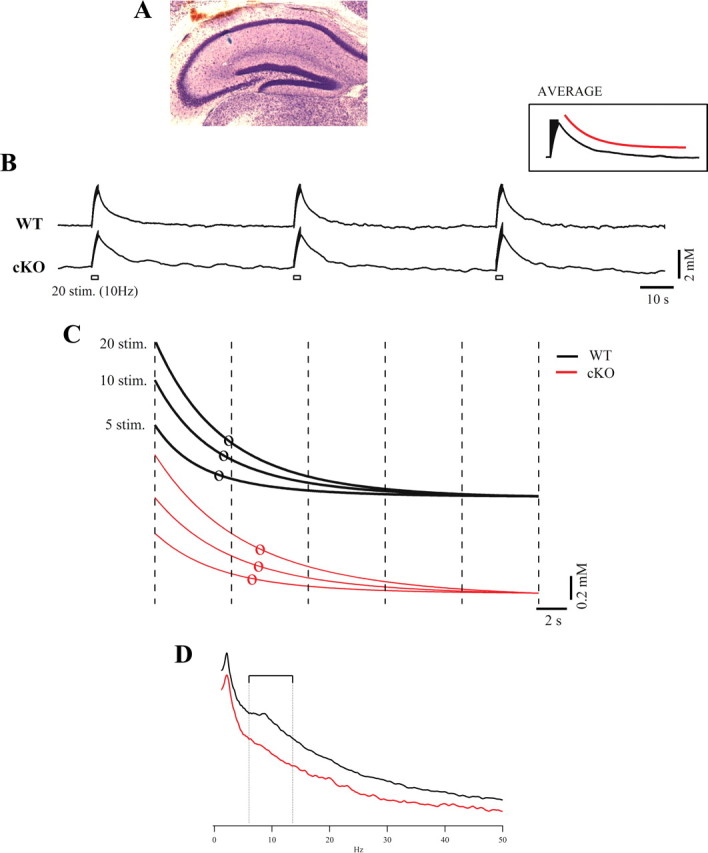
Kir4.1 cKO mice display impairment of extracellular potassium clearance. A, Hippocampal fast-green injection in one of the animals allowing the localization of the K+ recording electrodes. B, Representative recordings of [K+]o responses induced by trains of stimulation in WT and Kir4.1 cKO mice. The stimulations are indicated below the trace with rectangles. The inset depicts an average response to a train of 10 stimuli from one animal (black trace) and the exponential curve fitting of the former (red trace). C, The grand average trace of the exponential fittings after 5, 10, and 20 stimulations for WT (n = 12; black traces) and cKO (n = 10; red traces) groups. Circles indicate the respective time constants. D, Grand average of power spectra of local field potentials from the two groups of mice (WT, black trace; cKO, red trace; n = 5 in each group). The two power spectra are statistically distinct (p < 0.05) for the whole calculated range, with an additional difference within the 6–13 Hz frequency band (between dotted vertical lines) case in which the p values were <0.01 (Mann–Whitney U test).