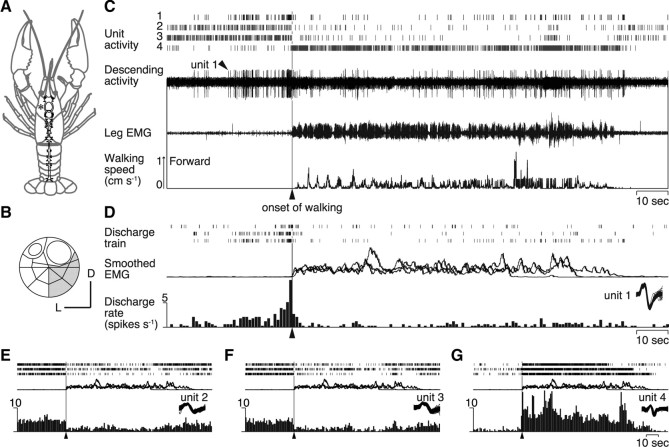
Figure 2.
Descending unit activities recorded from a crayfish walking freely on a spherical treadmill. A, CNS of crayfish. B, Location on the cross-sectional map of Wiersma (1958) of the small bundle from which the recording was made in the circumesophageal commissure at the site shown with an asterisk in A. C, Four descending unit activities (1–4) isolated from the bundle recording by a spike analysis software. In the top panel are shown their spike trains. The extracellular recording is shown in the next panel, followed by an EMG and the record of treadmill movements. D, Activity profiles of unit 1. All obtained recordings are shown with rasters of spike trains on the top. Smoothed EMGs are superimposed below. The three traces of the responses of unit 1 were recorded during the three walking bouts in Figure 1B. At the bottom is shown a perimovement time histogram with the time bin of 1 s. They are aligned to the behavioral onset time of walking. Activity of unit 1 (arrowhead) showed a significant increase before the onset of walking (vertical line). E–G, Activity profiles of three descending units (2–4) with the same convention as in D.

