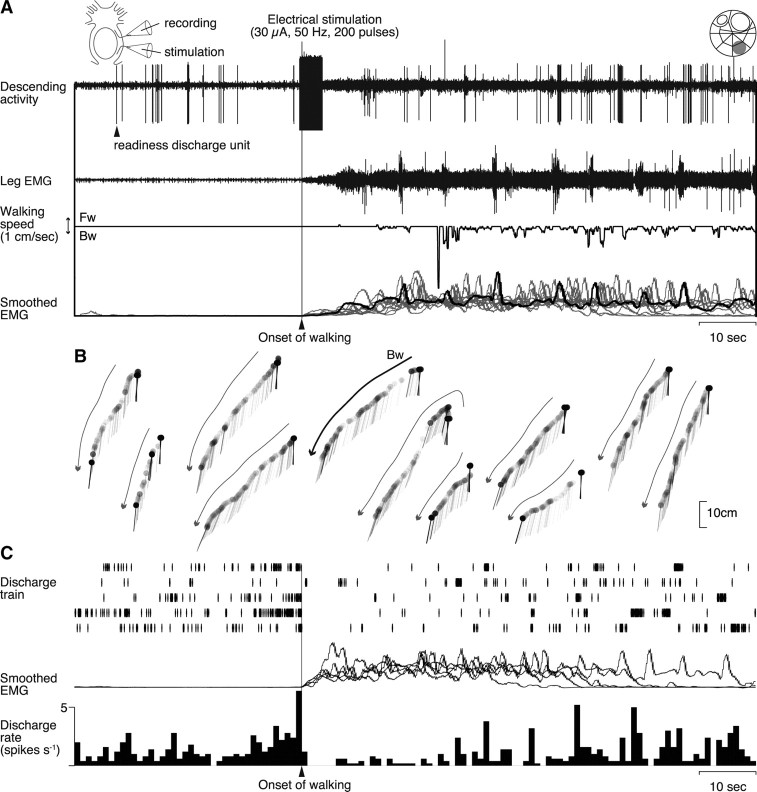
Figure 7.
Walking behavior initiated by electrical stimulation of a readiness discharge unit. A, Effects of electrical stimulation on the leg muscle activity. The stimulus artifact in the rostral cut end recording (top trace) indicates the onset and offset time of the stimulus (200 pulses of 0.2 ms duration at 50 Hz, 30 μA). The stimulation first caused a slow tonic increase followed by rhythmical bursts in the EMG activity recorded from the mero-carpopodite muscle of the second right leg (second trace). Leg movements resulted from the muscle activity were recorded as the movements of the treadmill sphere (third trace). Downward deflection indicates backward walking. At the bottom are superimposed all 11 EMGs (gray and black traces) that were integrated electronically with the time constant of 1 s, including the one corresponding to the record shown in the second trace (black line). All records were obtained from the stimulation of the same bundle. B, Displacement of the animal body reconstructed from the treadmill sphere movements. The curved arrows indicate the walking direction in each stimulation. The bold one corresponds to the experiment shown in A. Abbreviations are the same as in Figure 1. C, Activity profiles of the readiness discharge unit. Before the stimulation experiment, the descending spike activity of the unit was confirmed in the rostral cut end recording to precede the behavioral onset of spontaneously initiated walking. At the top are shown five traces of the spike trains. The integrated EMG activities are superimposed in the middle. The spike activity preceding the behavioral onset of walking is illustrated in the histogram at the bottom compiled from the spike trains shown above. All data in A–C were obtained from the same animal.

