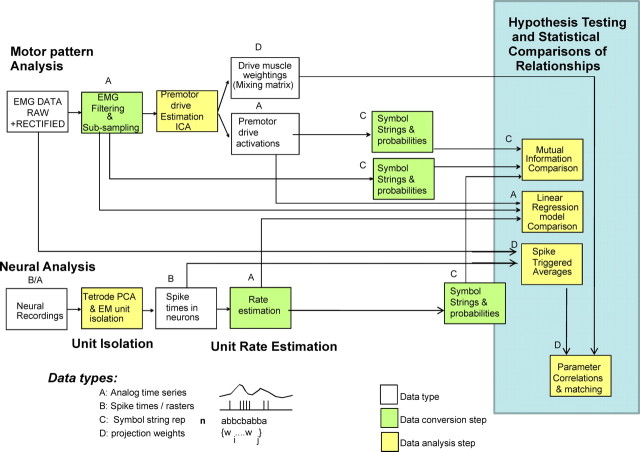
Figure 2.
Data analysis approach. Spike data were converted from analog recordings (type A in each analysis) to isolated unit spike times (type B) used in spike-triggered averages, to continuous rate estimates (type A) used for linear correlation based methods and to symbol string representations (15 ms bins, 8 symbols for level, type C) used for information-based analyses. Electromyograms were rectified filtered and used in ICA to obtain activation patterns of independent components or sources (type A) and their projection weights to muscles (type D). The resulting (type A) EMG and component waveforms were used in linear correlation methods and converted to symbol strings (15 ms bins, 8 symbols for level) for use in information techniques. Raw and rectified unfiltered EMG was used in spike-triggered averages to obtain significant facilitations and their magnitudes (type D). Comparisons and statistical tests of hypotheses were then made using the symbol string representations (C), the analog time series (A), and the projection weights and STA facilitation weights (D).

