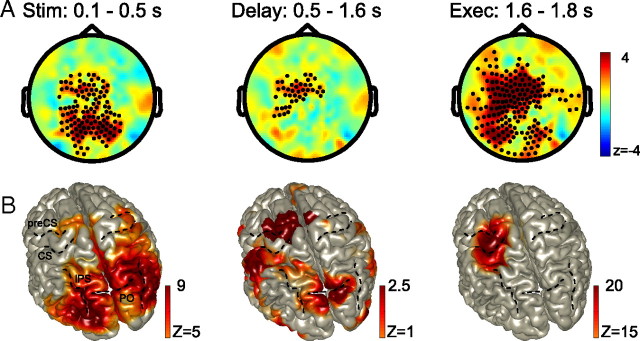
Figure 2.
A frontoparietal network shows increased power in the 70–90 Hz gamma band during reach planning and execution. A, Topographic representations of the gamma-band power during all three stages of the delayed-reach task (stimulus encoding, 0.1–0.5 s; delay period, 0.5–1.6 s; execution phase, 1.6–1.8 s). The color format is as follows: warmer (red) colors, power increase relative to baseline; cooler (blue) colors, power decrease. Sensors showing a significant change relative to baseline are marked. B, Reconstruction of the gamma-band sources. Because of spectral leakage caused by a strong frontal source (MNI coordinates: −20, 0, 60 mm), the reconstruction of the delay period was done in two steps: first by means of a conventional beamformer (represented by z scores well above 2.5, masked at z < 8) and second by means of a beamformer that suppressed the strong left-frontal source (Schoffelen et al., 2008) (represented by z < 2.5, masked at z < 1). Results of both analyses are plotted onto the same standard brain surface. Both the stimulus and execution period are standard one-dipole beamformers, masked at z < 5 and z < 20, respectively. CS, Central sulcus; preCS, precentral sulcus; IPS, intraparietal sulcus; PO, parieto-occipital sulcus.

