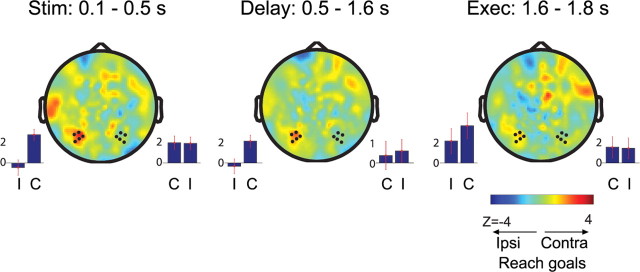
Figure 3.
A cluster of sensors overlying the left hemisphere shows direction-selective gamma-band activity (70–90 Hz) during the three different stages of the reach trials. The color format is as follows: warmer (red) colors, preference for stimuli in the contralateral hemifield; cooler (blue) color, bias toward ipsilateral stimuli. Sensors marked in the left hemisphere show significant effects in all stages (clustering and randomization approach) (see Materials and Methods). The bar graphs at either side of the topographic plots demonstrate the activation in relation to contralateral (C) and ipsilateral (I) reach goals, separately for the marked clusters in both hemispheres. The cluster of sensors overlying the right hemisphere was taken mirror-symmetric to that overlying the left hemisphere.

