
Figure 4.
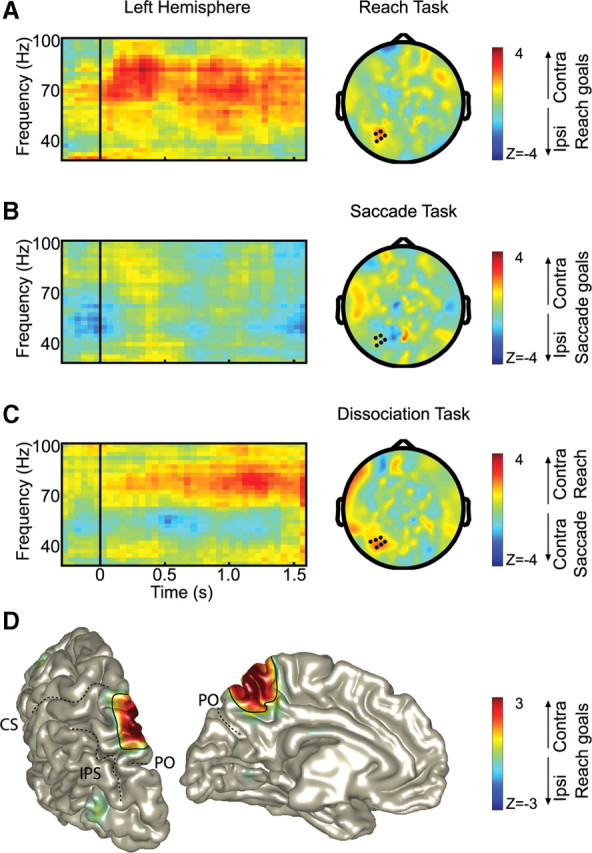
Direction-selective gamma-band synchronization during the three task conditions. A–C, Time–frequency resolved changes (left) of the direction-selective power of the sensors marked in the 70–90 Hz scalp topography (right) during the delay period (0.5–1.6 s). Only significant sensors are marked (p < 0.05, cluster randomization statistics). Time, t = 0, the time of stimulus presentation; t = 1.6, the time of the movement(s). Power is color-coded. In A, the topography plot replicates Figure 3, middle panel. D, Source of the reach gamma-band activity (80 ± 14 Hz) during the delay period of reach task, thresholded at z > 1, in the left hemisphere. The color format is as in A. PO, Parieto-occipital sulcus; CS, central sulcus; IPS, intraparietal sulcus.