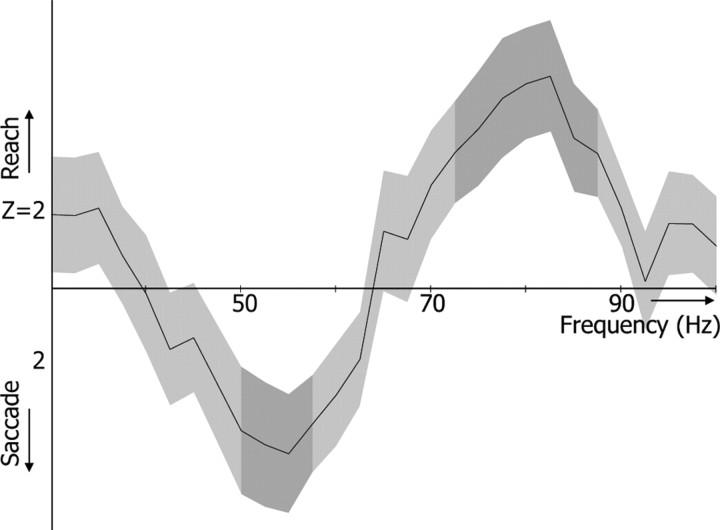
Figure 6.
Spectral dissociation between reach and saccade planning. Spectral power was averaged over time (0.1–1.6 s) and significant sensors (indicated in Fig. 5). The reach and saccade component were contrasted and statistically tested (cluster-randomization approach, p < 0.05). Positive z values represent specificity for contralateral reach goals; negative values represent specificity for contralateral saccade goals. The light-gray bands indicate SEM. The dark-gray zones indicate frequencies showing significant effector specificity.

