
Figure 4.
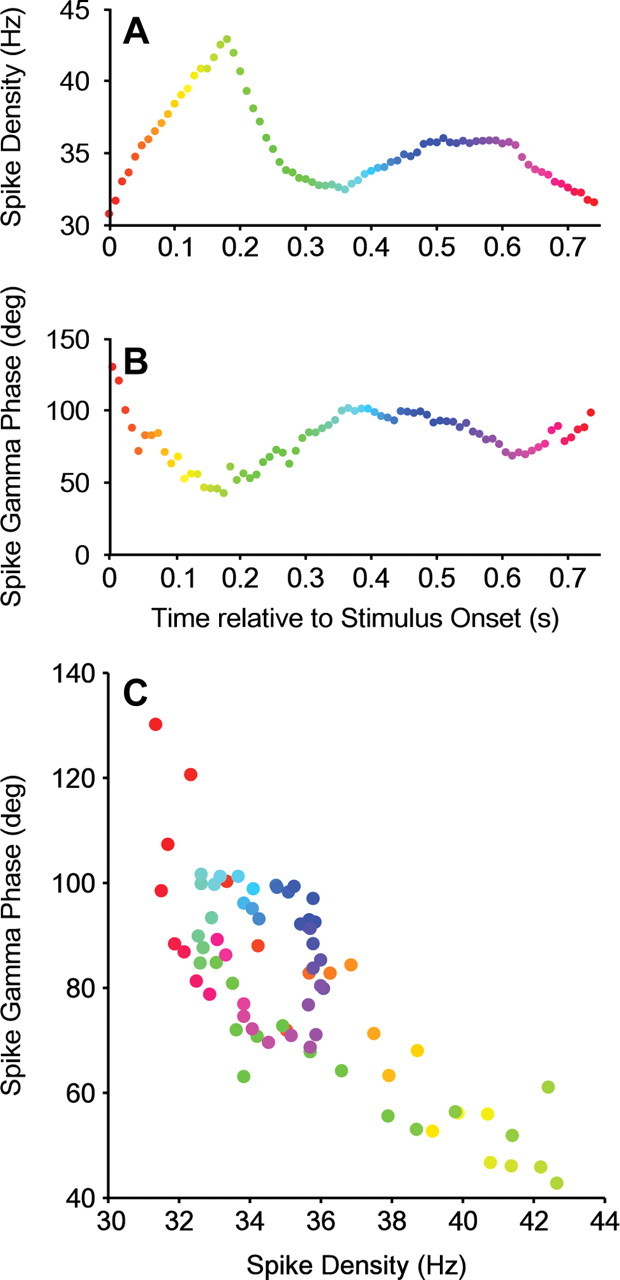
Temporal evolution of spike density and spike phase during the trial. A–C, Data from one example neuron. A, Spike density as a function of time after stimulus onset, calculated in 250 ms rectangular windows. The fluctuations in spike density are predominantly driven by the onset transient and the position of the drifting grating over the receptive field of the neuron. B, Same analysis but for the spike phase in the gamma cycle. C, Same data as in A and B but now showing spike phase directly as a function of spike density.