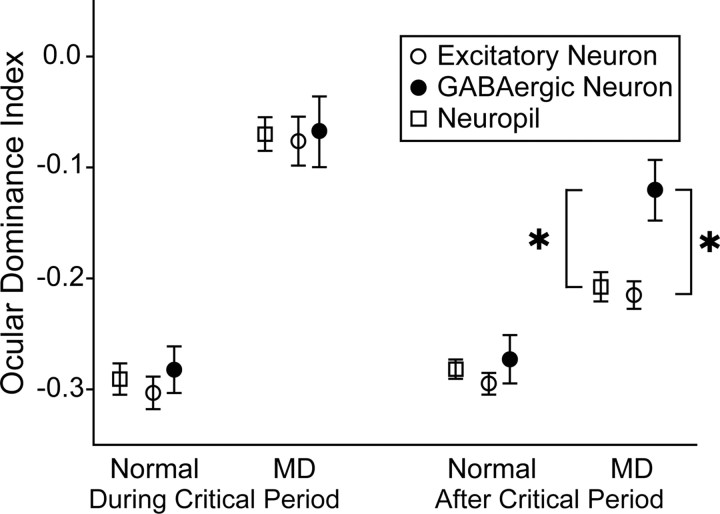
Figure 6.
Mean ODIs of excitatory (open circles) and GABAergic (filled circles) neurons obtained from four different groups of mice. The values of neuropil signals were also included (open squares). Vertical bars indicate SEMs. Mean values for the 903 excitatory and 115 GABAergic neurons of the normally reared mice at the age during the critical period were −0.303 ± 0.015 (SEM) and −0.282 ± 0.021, respectively. Those for the 445 excitatory and 114 GABAergic neurons in the deprived mice during the critical period were −0.076 ± 0.022 and −0.068 ± 0.032, respectively. Mean values for the 1529 excitatory and 182 GABAergic neurons of the normally reared mice at the age after the critical period were −0.295 ± 0.010 and −0.273 ± 0.022, respectively, and those for the 1266 excitatory and 128 GABAergic neurons in the deprived mice after the critical period were −0.215 ± 0.012 and −0.121 ± 0.027, respectively. Mean values of neuropil signals of the four groups of mice from the leftmost to rightmost columns were −0.291 ± 0.014 (n = 180), −0.070 ± 0.015 (n = 175), −0.282 ± 0.009 (n = 268), and −0.208 ± 0.013 (n = 255), respectively. *p < 10−4, Mann–Whitney test. MD, Monocular visual deprivation.

