
Figure 5.
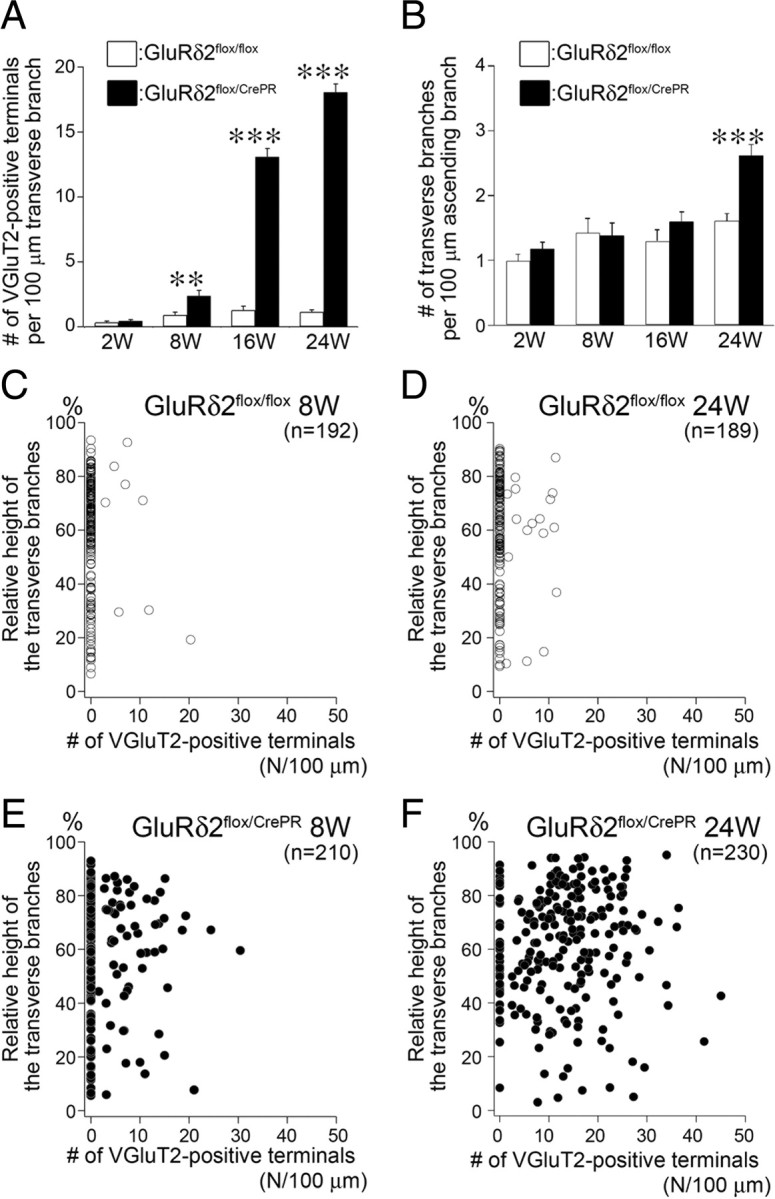
Progressive terminal differentiation in transverse CF branches in a superficial half of the molecular layer after induction of GluRδ2 ablation. A, The mean number of VGluT2-positive terminals per 100 μm of transverse branches in GluRδ2flox/flox (white bars) and GluRδ2flox/CrePR mice (black bars). Scores are 0.34 ± 0.10 (n = 45 transverse branches), 0.91 ± 0.23 (n = 39), 1.29 ± 0.30 (n = 35), and 1.14 ± 0.16 (n = 51) in GluRδ2flox/flox mice, and 0.44 ± 0.12 (n = 52), 2.37 ± 0.43 (n = 38), 13.1 ± 0.63 (n = 41), and 18.1 ± 0.64 (n = 68) in GluRδ2flox/CrePR mice at 2, 8, 16, and 24 weeks, respectively (mean ± SEM; p = 0.67 at 2 weeks, 0.0066 at 8 week, p < 0.00001 at 16 and 24 weeks, U test). B, The mean number of transverse CF branches emitting from 100 μm of ascending CF branches in GluRδ2flox/flox (white bars) and GluRδ2flox/CrePR mice (black bars). Scores are 0.98 ± 0.10 (n = 51 ascending branches), 1.43 ± 0.22 (n = 48), 1.30 ± 0.18 (n = 42), and 1.61 ± 0.11 (n = 51) in GluRδ2flox/flox mice, and 1.18 ± 0.10 (n = 56), 1.38 ± 0.19 (n = 61), 1.60 ± 0.15 (n = 40), and 2.61 ± 0.17 (n = 67) in GluRδ2flox/CrePR mice at 2, 8, 16, and 24 weeks, respectively (mean ± SEM; p = 0.13, 0.80, and 0.07 at 2, 8, and 16 weeks, respectively; p < 0.00001 at 24 weeks, U test). Error bars indicate SEM. **p < 0.01, ***p < 0.001. C–F, Scatterplots of the number of VGluT2-positive terminals per 100 μm of transverse branches (horizontal axis) against its relative vertical height in the molecular layer (vertical axis) in GluRδ2flox/flox (C, D, white circles) and GluRδ2flox/CrePR (E, F, black circles) mice at 8 weeks (C, E) and 24 weeks (D, F) after RU administration.