Figure 2.
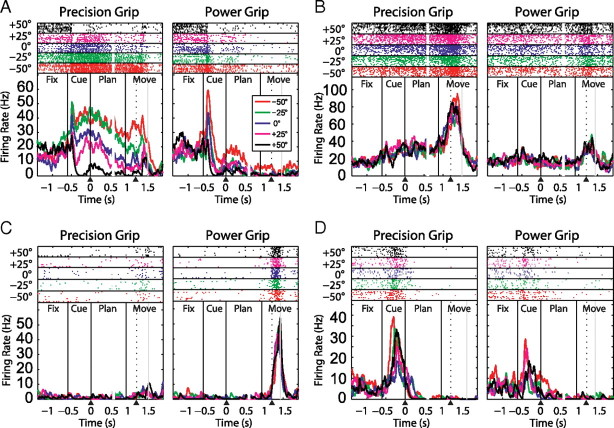
Firing rate histograms and raster plots of four example neurons. A–D, Left, Precision grip trials. Right, Power grip trials. The five orientations are represented by different colors. Graphs are doubly aligned to the end of the cue and the release of the handrest button (black arrowheads). Realignment occurs at 0.6 s and is marked by a gap in the curves and the spike rasters. Black vertical lines mark cue onset, cue offset, and the go-signal. The dotted line within the movement epoch indicates the handrest release and the gray line the (mean) time of handle contact. A, Neuron modulated by grip type and orientation from the cue until completion of the task. B, Neuron modulated by grip type only, starting from the cue until task completion. C, Neuron showing no task modulation during cue and planning, but clear grip-type tuning during movement execution. D, Neuron modulated by grip type and orientation exclusively in the cue period.

