
Figure 4.
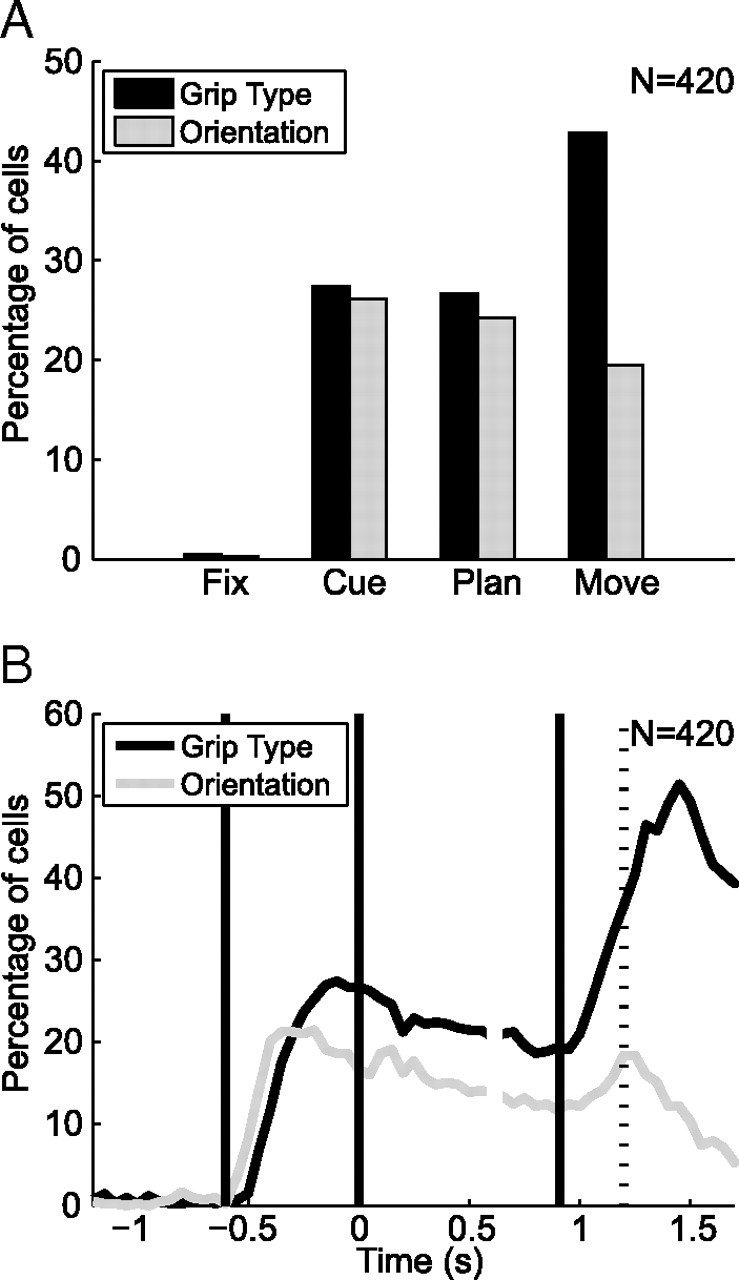
Grip type and orientation tuning in the population (n = 420). A, Percentage of cells that are tuned for grip type (black) and object orientation (gray) during each task epoch (fixation, cue, planning, and movement) (ANOVA, p < 0.01). B, Percentage of tuned cells for grip type (black) and object orientation (gray) in 200 ms time windows (ANOVA, p < 0.01; curves report data at the center of each window). Alignment and definition of time epochs as in Figure 2.