
Figure 7.
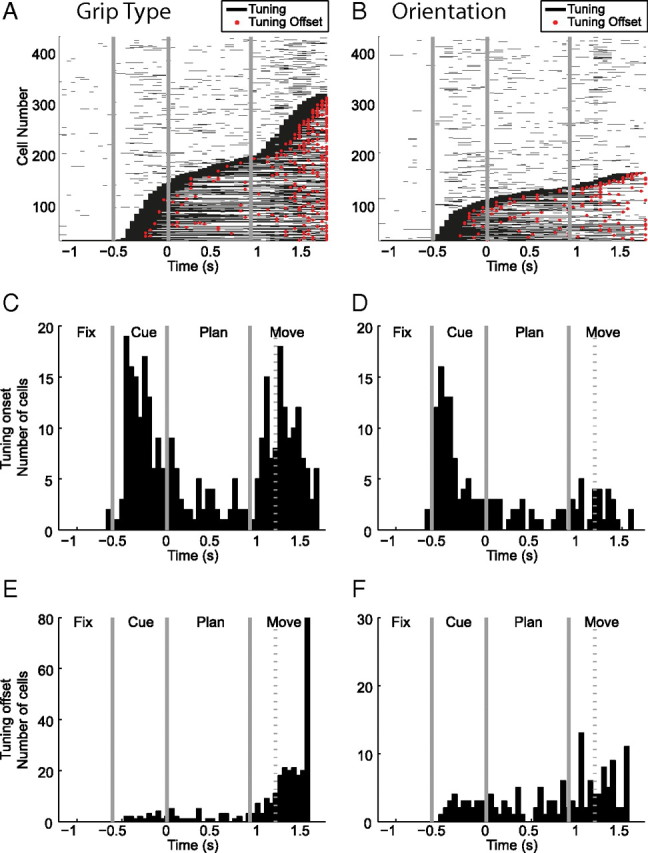
Time of significant tuning of grip type and orientation. A, Sliding window analysis indicating the times with significant grip-type tuning (black lines) for each cell (ANOVA, p < 0.01; window size, 200 ms; step, 50 ms; centered in the middle of the window). Cells are ordered by tuning onset; red dots indicate tuning offset. B, Same as A, for orientation tuning. C–D, Histograms of tuning onset of grip type and orientation. E–F, Histograms of tuning offset for grip type and orientation.