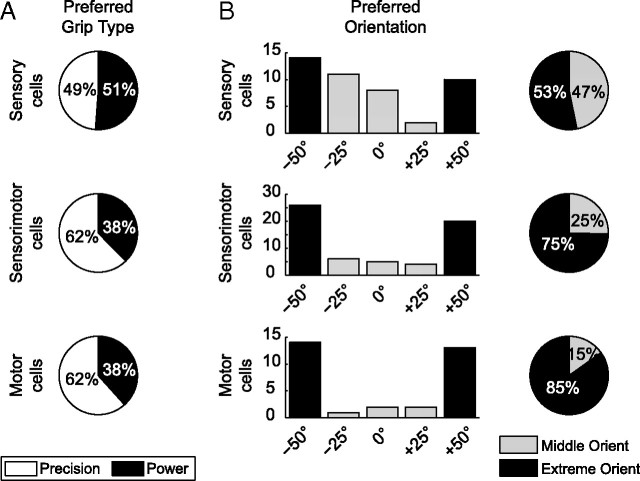
Figure 9.
Specific tuning for grip type and orientation (orient) in cell classes. A, Percentage of grip type-specific cells preferring precision (white) versus power grip (black) for sensory, sensorimotor, and motor cells. B, Histogram, Number of cells preferring individual object orientations (−50°, −25°, 0°, 25°, 50°) for sensory, sensorimotor, and motor cells. Pie chart, Percentage of orientation-specific cells preferring extreme orientations (black) or middle orientations (gray).

