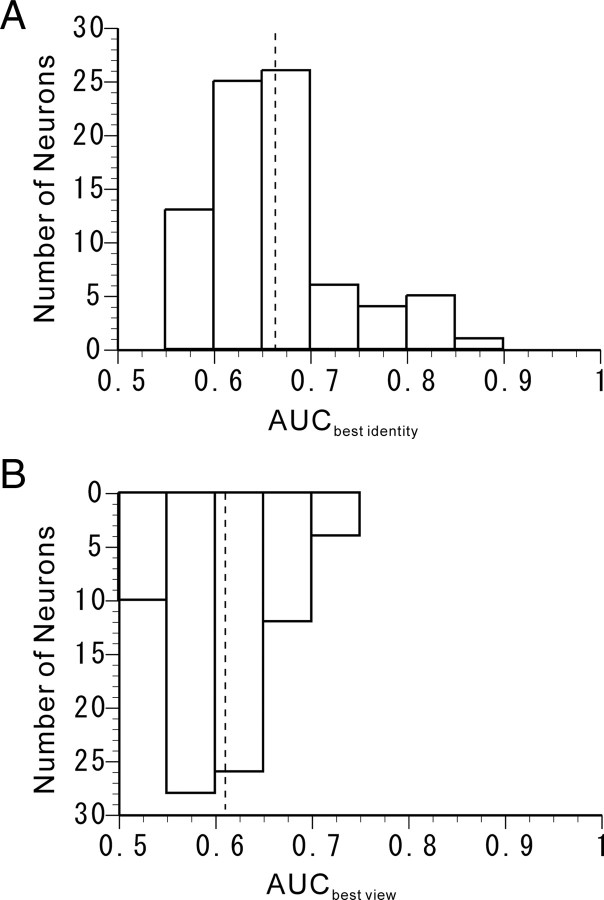
Figure 4.
ROC analysis of individual associative-pair-responsive neurons. A, Distribution of the AUCbest identity obtained from the ROC curve to best discriminate facial identity. The dashed line on the graph indicates the mean AUCbest identity. B, Distribution of the AUCbest view obtained from the ROC curve to best discriminate facial views. The dashed line on the graph indicates the mean AUCbest view.

