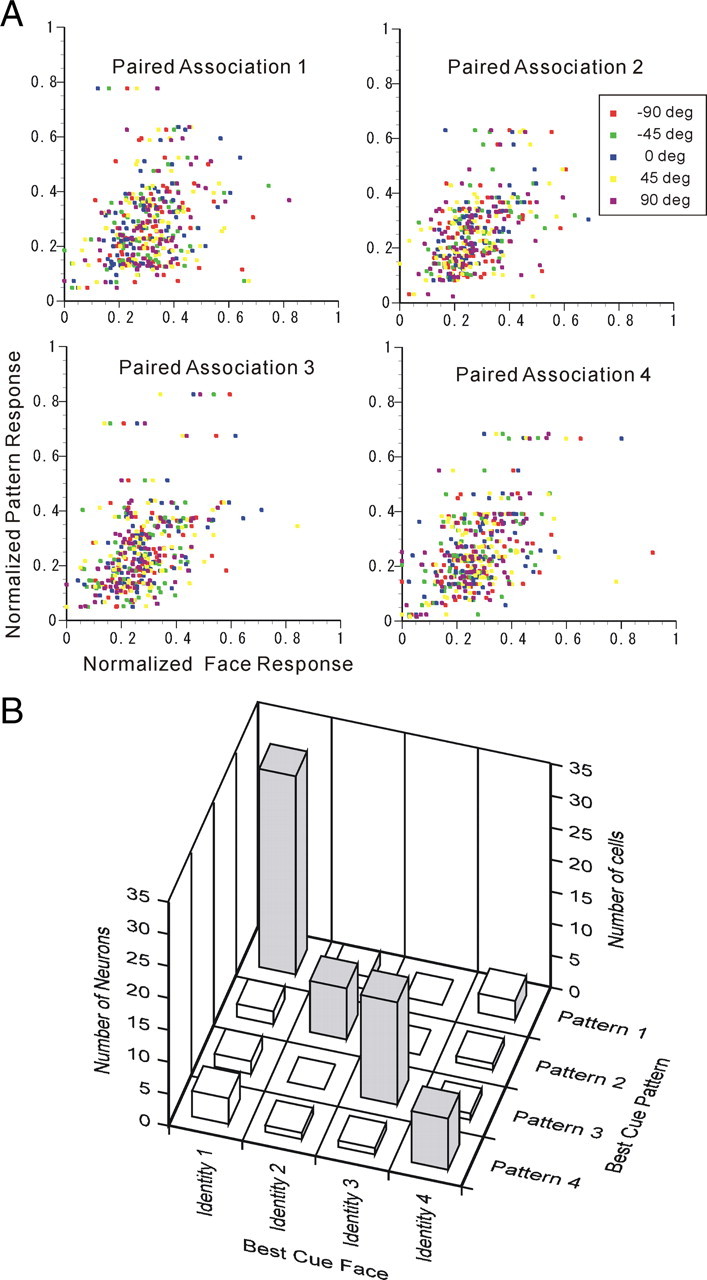
Figure 5.

Associative-pair selectivity of individual associative-pair-responsive neurons. A, Scatter plot between cue face responses and cue-pattern responses in paired associations 1 to 4. The spontaneous activities were subtracted from the responses, and then the responses were normalized by the norm of responses to the 24 visual stimuli. Different facial views are indicated by different colors. B, Comparison between best-cue patterns and best-cue faces of the associative-pair-selective (dark; n = 63) and other responsive [white; n = 17 (80 − 63)] neurons. The diagonal positions imply that the best-cue patterns and best-cue faces were in agreement.
