Figure 4.
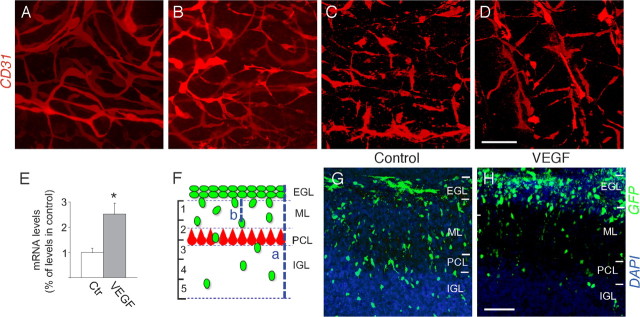
Ex vivo overexpression of VEGF in the EGL induces GC migration defects. A–D, Immunostaining of cerebellar slices for CD31, revealing progressive regression and disintegration of blood vessels at day 1 (A), day 2 (B), day 3 (C), or day 4 (D) of culture. E, Quantitative RT-PCR analysis, revealing a 250% increase of VEGF mRNA levels in cerebellar slices electroporated with a plasmid encoding VEGF compared with slices electroporated with the corresponding control plasmid (N = 5; *p < 0.05). Results are normalized to the expression levels in the control. Error bars indicate SEM. F, Scheme illustrating the methods used to quantify GC migration in the electroporated cerebellar slices. The cerebellar cortex from the EGL to IGL (a) was divided in five equally spaced areas, and the number of GFP+ GCs that reached each of these areas and had migrated a specific distance from the EGL/ML border (b), was counted. G, H, Confocal microscopy of electroporated cerebellar slices after 4 d of culture, revealing that a substantial fraction of GFP+ GCs had already migrated into the PCL/IGL in control slices (electroporated with empty vector; G); by contrast, in slices electroporated with a VEGF expression plasmid (which results in ectopic expression of VEGF in the EGL), a larger fraction of GFP+ GCs stalled at the EGL/ML border (H). Scale bars: A–D, G, H, 100 μm.

