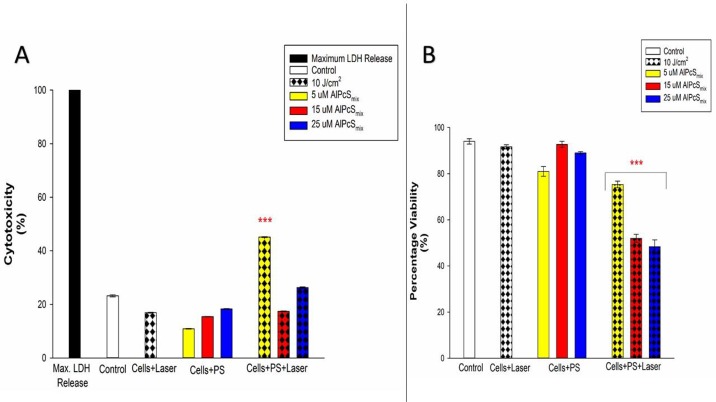
Figure 13. Post-irradiation biochemical response of normal cells exposed to PDT.
(A) Cytotoxicity of treated WS1 fibroblasts indicating insignificant increase in cytotoxicity of both treated and untreated cells with the exception of cells that received 5μM of PS which showed significant increase in cytotoxicity (p < 0.001). (B) Viability of treated WS1 fibroblasts showing a significant dose dependent decrease in the viability of PDT treated cells (p < 0.001) after 24 h of incubation. Control cells and groups that received either of the variables alone did not show significant decrease.

