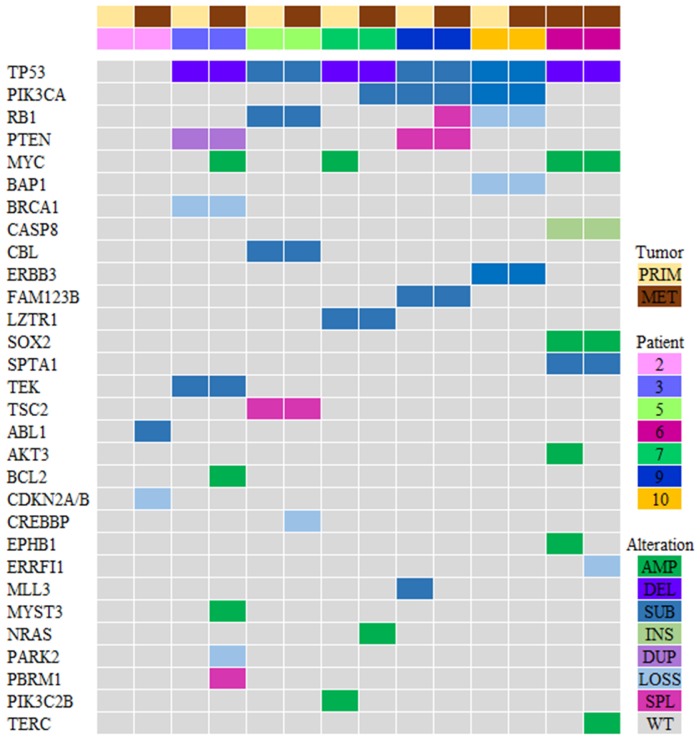
Figure 2. Genomic profiling of the PI3K pathway genes in TNBC (N = 7 patients).
Tile plot illustrating patients ordered by primary/metastatic status (columns), and by mutation frequency (rows). Variants of unknown significance (VUS) were not included in this analysis. Prim, primary tumor; Met, metastatic tumor; Amp, amplification; Del, deletion; Sub, substitution; Ins, insertion; Dupl, duplication; Splice, splice site; WT, wild type.

