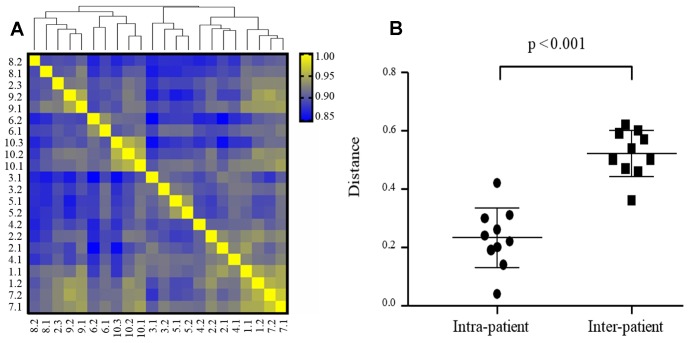
Figure 3. Intra- and inter-patient heterogeneity of mRNA expression in TNBC (N = 22 specimens).
(A) Hierarchical cluster analysis of gene expression data (24,041 transcripts) from 22 TNBC specimens based on Pearson’s correlation. The color scale is based on the values of correlation coefficients. Distance between samples indicates the similarity of gene expression profiles. (B) mRNA expression is more concordant in intra-patient tumors than inter-patient tumors. Euclidian distances were calculated based on PC1, PC2, and PC3.

