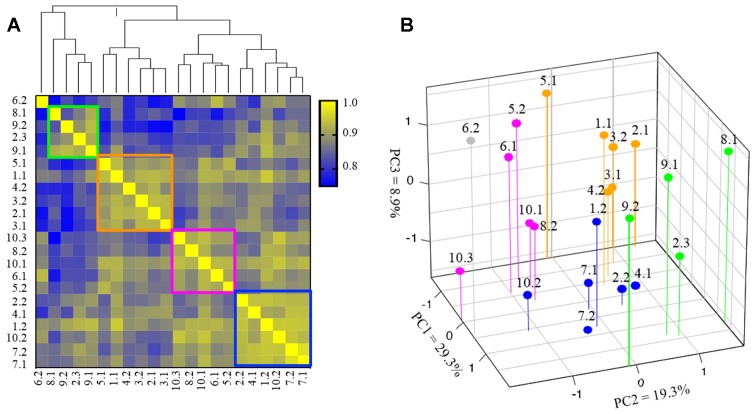
Figure 4. Subgroup clustering of PI3 kinase (PI3K) pathway genes (N = 22 specimens).
(A) Hierarchical cluster analysis based on expression of 45 genes involved in PI3K pathway in 22 TNBC specimens. The color scale indicates the degree of correlation. Distance between samples indicate the similarity of gene expression profiles. Groups 1–4 are marked in green, orange, pink and blue boxes, respectively. COH-6.2 (gray) is an outlier and cannot be classified into any of the 4 groups. (B) PCoA based on gene expression involved in PI3K pathway (samples are color-coded into 4 groups as in 4A).

