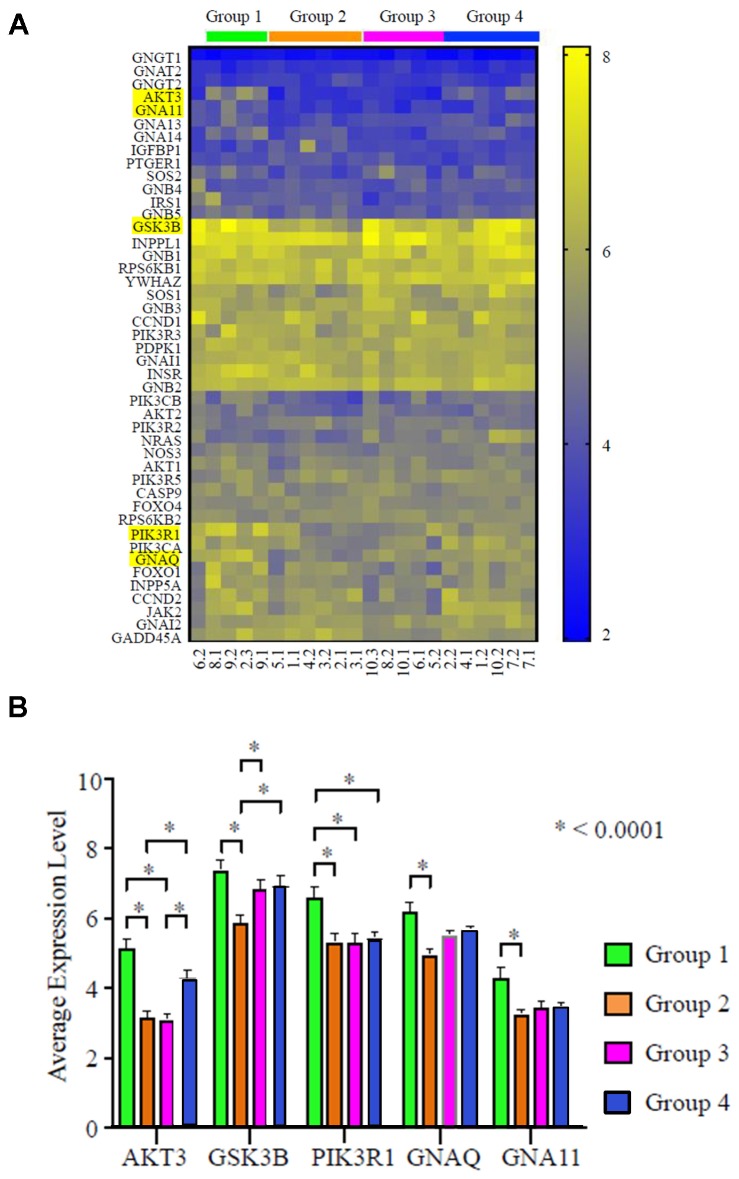
Figure 5. AKT3 is the most differentially expressed gene in the PI3K pathway in TNBC (N = 22 specimens).
(A) Heat map of gene expression profile of the PI3K pathway. The four groups identified in Figure 3A are indicated with respective color bars labeled above the heat map. The top 5 genes with the largest expression variance are highlighted. (B) Relative mRNA expression level of the top 5 differentially expressed genes in the 4 respective groups; * P > 0.0001.

