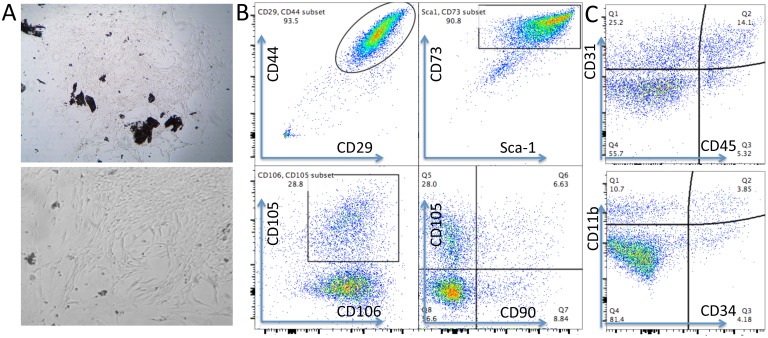
Figure 1. Phenotypes of mouse CB-MSCs.
(A) Morphology of primary CB-MSCs under microscopy. Upper: 10 x magnification, Lower: 20 x magnification. (B) Representative cytometric dot plots. Phenotypic markers of CD29, CD44, Sca-1, CD73, CD105, CD106 and CD90 were stained to identify MSCs at passage 2. CD90 expressed very low on CB-MSCs. (C) Negative markers of CD45, CD31, CD34 and CD11b were stained to help identify MSCs.

