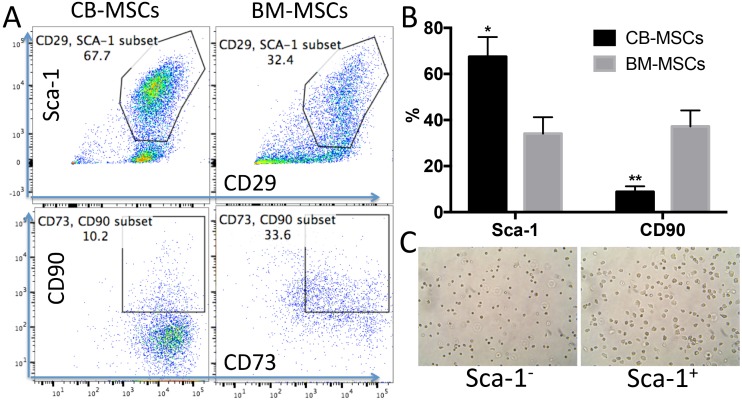
Figure 2. CB-MSCs express higher Sca-1 and lower CD90 compared to BM-MSCs.
(A) Representative cytometric dot plots of MSCs at passage 6. (B) Percentage of Sca-1 and CD90 positive population in CB-MSCs and BM-MSCs. (C) Microscopic images of sorted Sca-1 negative (Left) and positive cells (right), 20 x magnification.

