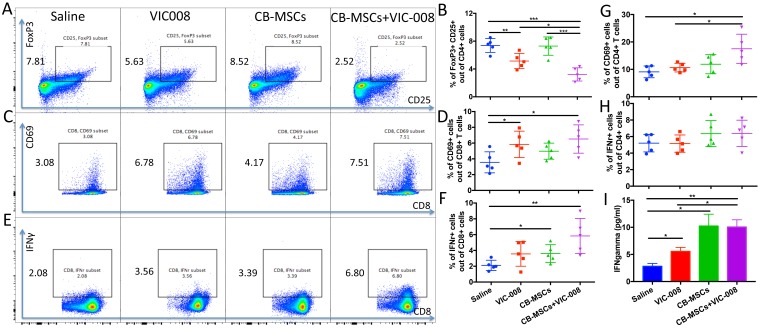
Figure 6. Combination therapy reduced Treg cells and activated CD8+ T cells and in splenocytes.
(A, B) Representative cytometric dot plots and quantification of CD4+CD25+FoxP3+ Treg cells. (C, D) Representative cytometric dot plots and quantification of CD8+CD69+ T cells. (E, F) Representative cytometric dot plots and quantification of CD8+IFNγ+ T cells. (G) Percentage of CD4+CD69+ cells. (H) Percentage of CD4+IFNγ+ T cells. (I) Quantification of IFNγ in the supernatant of cultured splenocytes after stimulation by mesothelin peptides by ELISA (n = 5).

