
Table 1:
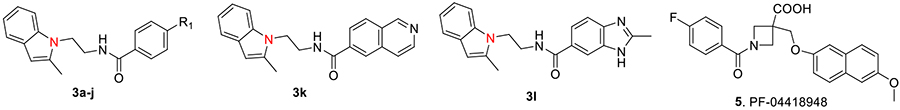
EP2 Potency, selectivity, aqueous-solubility and mouse liver microsomal stability of novel EP2 antagonists.a
| Entry | Compd. ID | R1 | EP2 KB (nM) | DP1 KB (μM) | SI (DP1KB/EP2 KB) | IP KB (μM) | SI (IP KB/EP2 KB) | Aq. solb. (nM) | MLMc t1/2 (min) |
|---|---|---|---|---|---|---|---|---|---|
| 3a | TG8-15 |  |
22.3 | 0.66 | 29 | >10 | >450 | 257 | 25 |
| 3b | TG8-185 |  |
560 | nd | nd | nd | nd | nd | nd |
| 3c | TG8-130 |  |
6.6 | 5.3 | 803 | 0.34 | 51 | 100 | 3.5 |
| 3d | TG8-168 |  |
4.4 | 0.27 | 61 | nd | nd | 100 | nd |
| 3e | TG8-184 |  |
50 | >10 | >200 | >10 | >200 | 223 | 7.7 |
| 3f | TG8-237 |  |
19.5 | 0.87 | 45 | nd | nd | 130 | nd |
| 3g | TG8-239 |  |
31.4 | >10 | >318 | 2.8 | 90 | 75 | nd |
| 3h | TG8-186 |  |
35 | >10 | >285 | 0.55 | 16 | 127 | 5.2 |
| 3i | TG8-238 |  |
46.6 | 4.9 | 105 | >10 | 215 | 75 | 1.8 |
| 3j | TG8-280 |  |
51 | 1.4 | 28 | 0.34 | 6.6 | 25 | nd |
| 3k | TG8-258 | see top of the table | 30.5 | 1.0 | 32 | 0.44 | 14 | 76 | nd |
| 31 | TG8-246 | see top of the table | 305 | nd | nd | nd | nd | nd | nd |
| 4 | TG8-69 | see Fig 1 | 48.5 | 18.0 | 370 | 130 | 2680 | 500 | >60 |
| 5 | PF-04418948 | see top of the table | 147 | 48.3 | 330 | 1.7 | 12 | nd | nd |
Schild KB values are calculated using the form ula log (dr-1) = log XB −log KB, where dr (dose ratio) = fold shift in EC50 of PG E2 by the test compound, XB is antagonist concentration (1 μM). KB value indicates a concentration required to produce a 2-fold rightward shift of PGE2 concentration response curve. KB values are average of 2–3 m easurem ents run in duplicate.
The aqueous-solubility of the compounds is measured in PBS buffer (pH 7.4) with 1% DMSO by nephelom etry.26 nd = not determined.
MLM = mouse liver microsomes. Compounds 3b and 3l were low potency compounds, therefore they were not tested in selectivity and solubility assays.