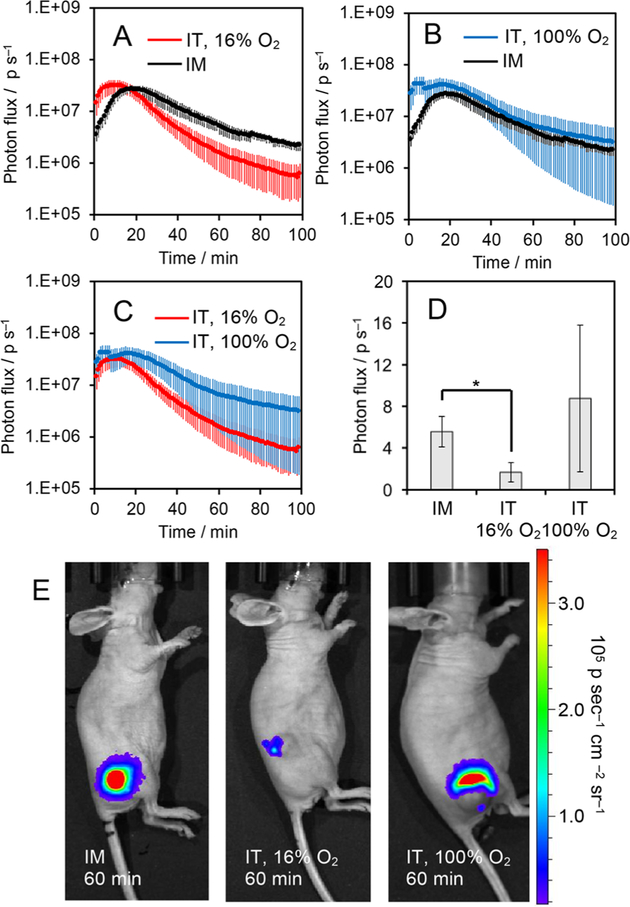
Figure 4.
Measuring oxygenation in healthy muscle tissue and tumor xenografts. (A–C) Time course of the chemiluminescence emission of 30 of 120 μM HyCL-4-AM in 20 mM PBS (pH 7.4) containing 2.4% DMSO in athymic nude mice after intramuscular (IM) injection into the flank, intratumoral injection while mice were breathing 16% O2 (IT, 16% O2), and intratumoral injection while mice were breathing 100% O2 (IT, 100%). (D) Photon flux and (E) chemiluminescence images of athymic nude mice 60 min after IM injection, IT injection while mouse breathed 16% O2, and after IT injection while mouse breathed 100% O2. Error bars are ± SE from n = 3–6 mice. Statistical significance was assessed using a two-tailed Student’s t test. *p < 0.05.

