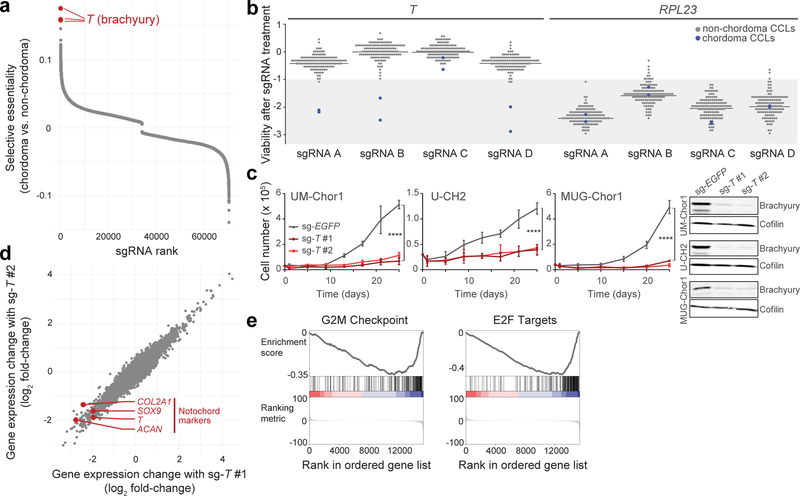
Figure 1. Genome-scale CRISPR-Cas9 screening identifies T (brachyury) as a selectively essential gene in chordoma cells.
a) Comparative analysis of genome-scale CRISPR-Cas9 screening results generated in UM-Chor1 and MUG-Chor1 chordoma cell lines versus 125 non-chordoma cancer cell lines. SgRNAs were ranked by and plotted against selectively lethal effects (RNMI scores; see Methods) in chordoma versus non-chordoma cell lines. The top three sgRNAs (red circles) all target T. b) Viability after sgRNA treatment (represented by sgRNA-dependency scores; see Methods) corresponding to each of the four primary screening sgRNAs targeting either T or RPL23 across 127 cancer cell lines (CCLs), including 2 chordoma CCLs (blue circles). For each sgRNA, the median sgRNA-dependency score across 127 cell lines is indicated (gray line). Lower values indicate greater sgRNA depletion and thus essentiality of the target gene (shaded region). c) (Left) Proliferation of chordoma cell lines transduced with sgRNAs targeting T or a non-targeting sgRNA control. Points represent the mean ± SD (n = 3 biological samples measured in parallel). **** p < 0.0001, derived from a two-way ANOVA (p-values for the test comparing sg-EGFP and sg-T #1 are displayed). Exact p-values and effect sizes are reported in Supplementary Table 9. (Right) Immunoblot analysis of transduced cells confirming sgRNA-mediated protein repression. Proliferation experiments were performed twice with UM-Chor1 and U-CH2 cells (one representative experiment displayed for each) and once with MUG-Chor1 cells; immunoblots were performed once. d) Relative gene expression of UM-Chor1 cells transduced with one of two sgRNAs targeting T versus a non-targeting sgRNA control. Gene expression was measured with RNA sequencing. Data represent two biological replicates per condition. e) Gene-set enrichment analysis results show significant downregulation of genes associated with cell cycle progression, such as drivers of G2/M checkpoint progression and E2F targets.

