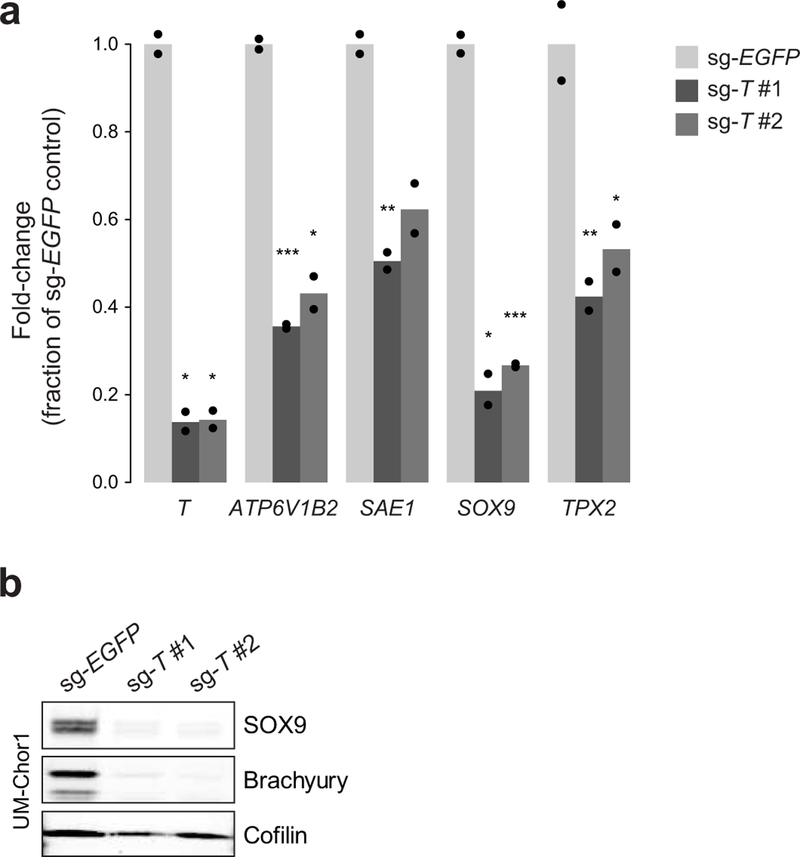
Extended Data Figure 9. Expression of ATP6V1B2, SAE1, SOX9, and TPX2 is downregulated following sgRNA-mediated T (brachyury) repression.
a) UM-Chor1 cells were transduced with sgRNAs targeting T or a non-targeting sgRNA control and subjected to RT-qPCR. Data are expressed as the fold-change of transcript levels relative to sgRNA control-treated cells, normalized to GAPDH levels, and represent the mean (n = 2 biological samples measured in parallel, represented by black points). * p < 0.05; ** p < 0.01; *** p < 0.001; p-values were derived from a one-sided Welch’s t-test. Exact p-values and effects sizes are reported in Supplementary Table 9. b) Immunoblot analysis of UM-Chor1 cells transduced with sgRNAs targeting T or a non-targeting sgRNA control. SgRNA treatment was performed once and immunoblotting was performed twice (one representative experiment displayed).

