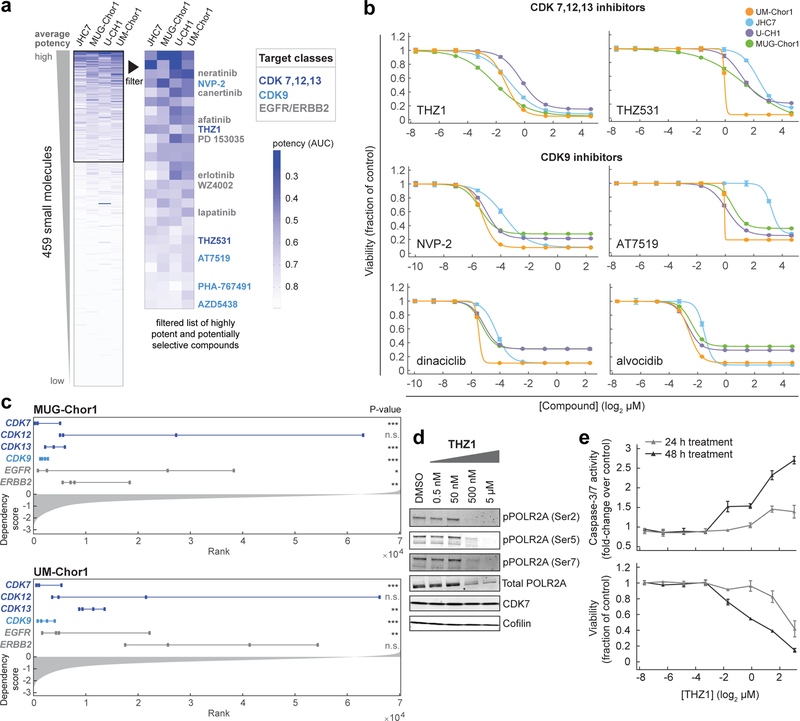
Figure 2. Small-molecule sensitivity profiling identifies inhibitors of CDK7/12/13 and CDK9 as potent antiproliferative agents in chordoma cells.
a) Profiling results for 459 small molecules tested in four chordoma cell lines. Data represent area-under-curve (AUC) values calculated from 8-point concentration-response curves generated in duplicate, and coloring in the heatmap is representative of smaller AUC values (blue) corresponding to more potent effects (AUC value of 1 = vehicle control; value of 0 = complete killing at all concentrations). Left heatmap, all compounds were ranked by average potency in chordoma cell lines; potent compounds (average AUC < 0.8, boxed) were then filtered to exclude those with cytotoxic effects non-selective for chordoma cell lines versus up to 891 non-chordoma cancer cell lines, when such data were available in CTRP. Compounds that were only tested in chordoma cell lines and were not available in CTRP were not filtered beyond the initial potency filter. Twenty-eight compounds (right heatmap) passed these criteria. b) Validation of primary screening hits and related compounds. Four chordoma cell lines were treated with indicated concentrations of candidate antiproliferative compounds and assayed for cell viability after 6 d with CellTiter-Glo. Response data are represented by a fitted curve to the mean fractional viability at each concentration relative to vehicle-treated cells; error bars represent the SEM (n = 4 biological samples measured in parallel). c) Rankings of sgRNA-level dependency scores (see Methods) for the indicated genes following genome-scale CRISPR-Cas9 screening (see Fig.1). Points represent each of four sgRNAs targeting a given gene that were present in the pooled CRISPR library used for screening. P-values were derived from a one-sided Mann-Whitney test. *, p < 0.05; **, p < 0.01; *** p < 0.001; n.s., not significant. The gray waterfall plot represents ranked dependency scores for all sgRNAs tested (median dependency score = −0.3257 for MUG-Chor1; median = −0.3283 for UM-Chor1). Median dependency scores for the four sgRNAs and exact Mann-Whitney p-values corresponding to each gene are reported in Supplementary Table 9. d) Immunoblot analysis of UM-Chor1 cells treated with indicated concentrations of THZ1 or DMSO for 24 h. Data are representative of two independent experiments. e) Caspase-3/7 activity (top) and cell viability (bottom) following THZ1 treatment of UM-Chor1 cells. Caspase-3/7 activity and cell viability were measured in parallel at the indicated time points using Caspase-Glo 3/7 and CellTiter-Glo reagents, respectively. Data are expressed as the fold-change of caspase-3/7 activity (top) or fraction of cell viability (bottom) relative to vehicle-treated cells and represent the mean ± SD (n = 4 biological samples measured in parallel).

