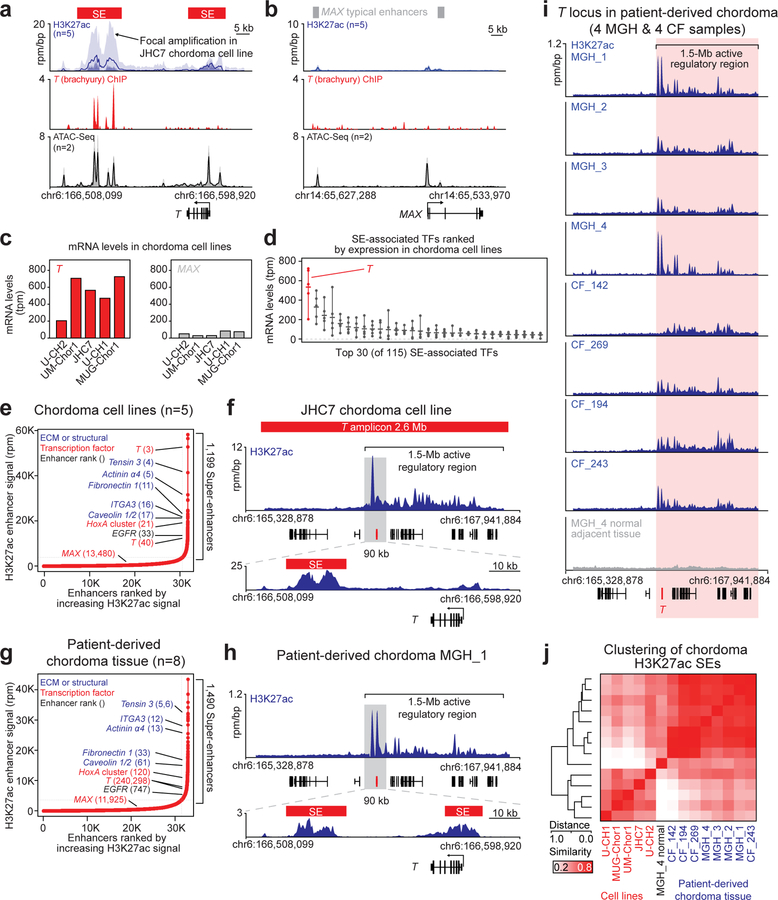
Figure 3. T (brachyury) is super-enhancer-associated and highly active across chordoma cell lines and in patient-derived chordoma tumors.
a,b) Gene tracks of H3K27ac, brachyury, and ATAC-seq signal (units of reads per million per base pair) at the T and MAX gene loci. For datasets with multiple samples (H3K27ac and ATAC-seq), signals for samples are plotted as a translucent shape and darker regions indicate regions with signal in more samples. An opaque line is plotted and gives the average signal across all samples in the group. H3K27Ac ChIP-seq was performed on 5 chordoma cell lines (UM-Chor1, MUG-Chor1, U-CH2, U-CH1, JHC7); brachyury ChIP-seq was performed on 1 chordoma cell line (U-CH1) as previously reported33; and ATAC-seq was performed on two chordoma cell lines (2 biological replicates for U-CH2 and 1 replicate for MUG-Chor1). c) Bar graphs of RNA-seq mRNA levels for T and MAX across 5 chordoma cell lines. Units are in transcripts per million (tpm). d) Gene expression levels of the top 30 (of 115) super-enhancer (SE)-associated transcription factors in 5 chordoma cell lines (points), ranked by mean expression (horizontal ticks). e,g) Enhancers in chordoma cell lines (UM-Chor1, MUG-Chor1, U-CH2, U-CH1, JHC7) or patient-derived chordoma tumor tissue ranked by average H3K27ac signal across samples. SEs and associated genes are annotated along the vertical axis and were determined by the inflection point of the plot. f,h) Gene tracks of H3K27ac signal at the T-amplified region in the JCH7 cell line and the corresponding region in the MGH_1 chordoma tumor. The amplicon and T-proximal SEs are shown (red boxes). i) Gene tracks of H3K27ac signal across eight patient-derived chordoma tumor samples and one matched normal adjacent muscle sample at the T locus. j) Clustergram of chordoma samples hierarchically clustered by similarity of H3K27ac signal at the union of all SE regions across samples.

