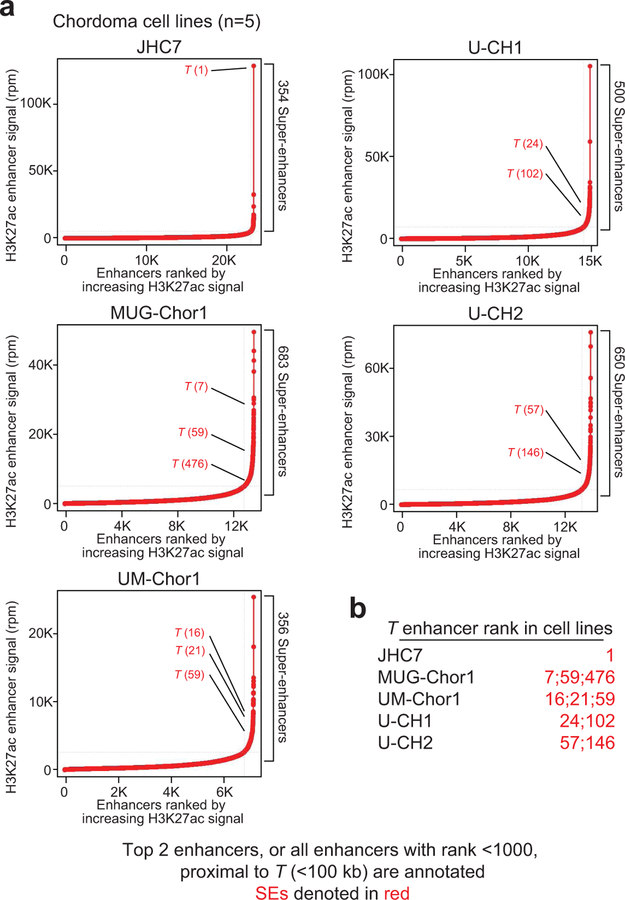
Extended Data Figure 4. T is super-enhancer-associated across chordoma cell lines.
a) Enhancers in 5 chordoma cell lines ranked by H3K27ac signal in each sample. Enhancers proximal (within 100 kb) to the T gene start site are annotated, as described in the figure. Super-enhancers (SEs) were determined by the inflection point of the plot. b) Table showing the ranks of top T-associated enhancers in each chordoma sample.

