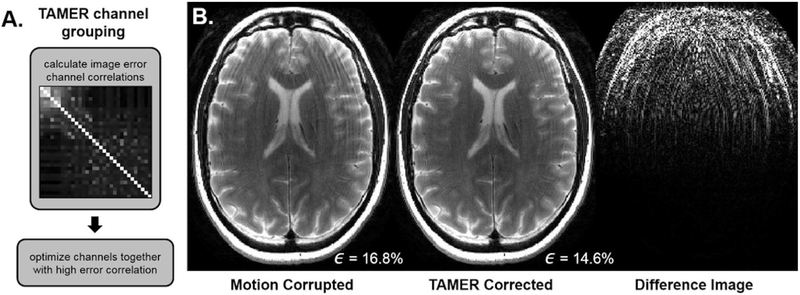
Fig. 10.
In Vivo Results. A. The image-space data consistency error correlation across the 32 coils was calculated. Channels with high error correlation were grouped together in the TAMER optimization, those with little data consistency error were assumed to have zero motion. B. (Left) Motion corrupted image (Middle) TAMER corrected image. (Right) Difference image displayed at 10×. Data consistency error, ϵ, shown in bottom right.

