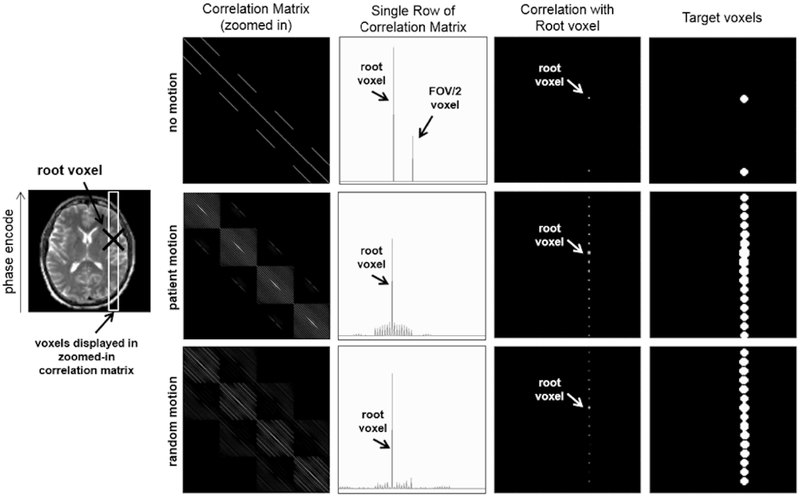
Fig. 3.
Target Voxel Selection. First Column: Correlation matrix () for the voxels shown in the white outlined ROI on the left (log scale). Second Column: For a given root voxel (i.e. one row of the correlation matrix), the correlation of the other voxels to the root voxel is plotted (linear scale). Third Column: The magnitude of each voxel’s correlation to the root voxel is plotted in image space (log scale). Fourth Column: The target voxels are chosen for a given region of correlated voxels using thresholding. The motion values used in the second row are from the motion trajectory measured during an fMRI scan of a patient with Alzheimer’s disease.

