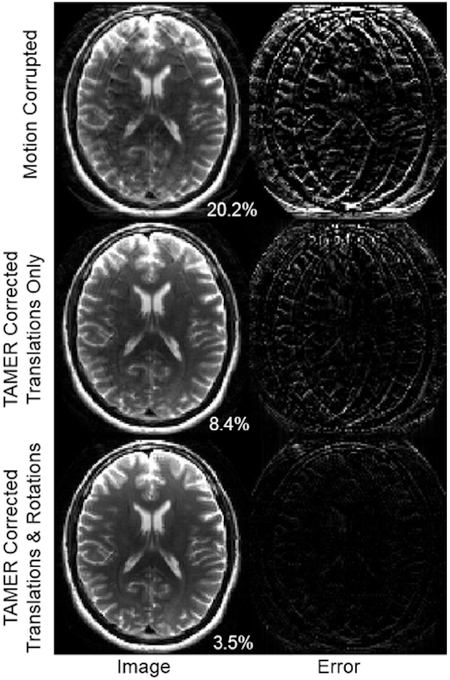
Fig. 4.
TAMER results in data with simulated motion. (Top) Motion corrupted image. Right column shows difference image formed from the gold standard (uncorrupted) image. (Middle) Image reconstructed using TAMER when only correcting for translations. (Bottom) Image reconstructed when optimizing for both in-plane translation and rotation. Percentages in bottom right correspond to image space RMSE compared to ground truth.

