Figure 4.
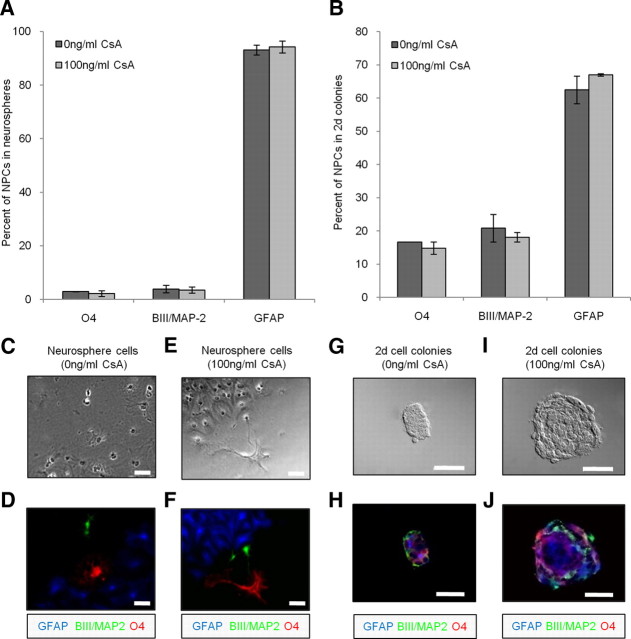
Cyclosporin A (CsA) did not promote selective cell survival. A, B, The percentages of oligodendrocytes, neurons, and astrocytes within neurospheres (A) and within multipotent gap chamber NPC colonies (2 d cell colonies) (B) did not differ between the control and treatment. C–J, Examples of control neurospheres (C,D), treatment neurospheres (E,F), control 2 d colonies (G,H), and treatment 2 d colonies (I,J). Red, Oligodendrocytes; green, neurons; blue, astrocytes. Scale bar, 50 μm. Data represent mean ± SEM.

