
Figure 7.
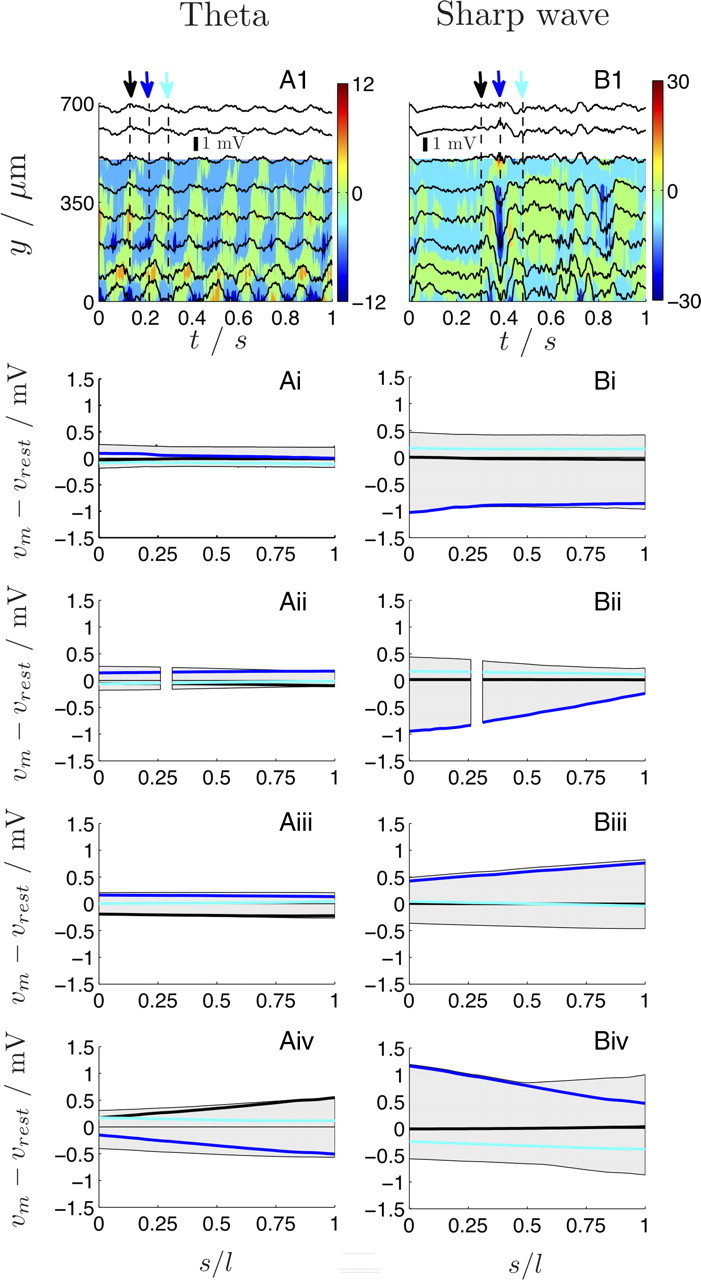
The effect of theta (left column) and SPW (right column) extracellular field activity on the membrane potential vm of a CA1 pyramidal neuron. A1, B1, The individual extracellular recordings (black traces) from equally spaced recording sites (8 of the 16 electrodes are shown) (supplemental Figs. S6, S7, available at www.jneurosci.org as supplemental material) are shown during two 1 s epochs, starting from the stratum lacunosum moleculare (y = 0 μm) toward the stratum oriens (y = 700 μm). The color map shows the current source density csde (units, millivolts per square millimeter) (Mitzdorf, 1985). Based on experimental evidence suggesting that the endogenous field is strongest along the somatodendritic axis of CA1 neurons, we applied the ve recordings (A1, B1) along the y-axis of the realistic neuron (Fig. 4A) and calculated the resulting spatiotemporal evolution of vm (supplemental section 7, available at www.jneurosci.org as supplemental material). Ai–Aiv, LFP-induced deviations of vm along each section (i–iv) (Table 1) during theta. The gray areas indicate the range, whereas the three individual traces show vm − vrest along each section for t = 0.13 s (black), 0.22 s (blue), and 0.30 (cyan) and are indicated by the arrows in the top row. The periodic fluctuations of the extracellular potential induces a location-specific fluctuation of the membrane potential that increases in amplitude toward stratum lacunosum moleculare. The antiphase relationship between the somatic and apical dendritic ve fluctuations results in an antiphase vm fluctuation; that is, compare vm at the theta peak (black arrow and lines) and at the trough of theta (blue arrow and lines) at the soma (Aii) and the distal apical section (Aiv), respectively. Bi–Biv, LFP-induced changes in vm during the SPW. The three individual traces show vm − vrest along each section for t = 0.30 s (black), 0.38 s (blue), and 0.48 (cyan). Note the pronounced antiphase relationship in vm at the SPW negativity (blue arrow and lines) between the soma (Bii) and the medial apical section (Biii). Unlike theta, the somatic membrane potential is significantly, but transiently, entrained during the SPW: compare vm deviations immediately before (black arrow and lines) and after (cyan arrow and lines) the SPW (supplemental movies, available at www.jneurosci.org as supplemental material).