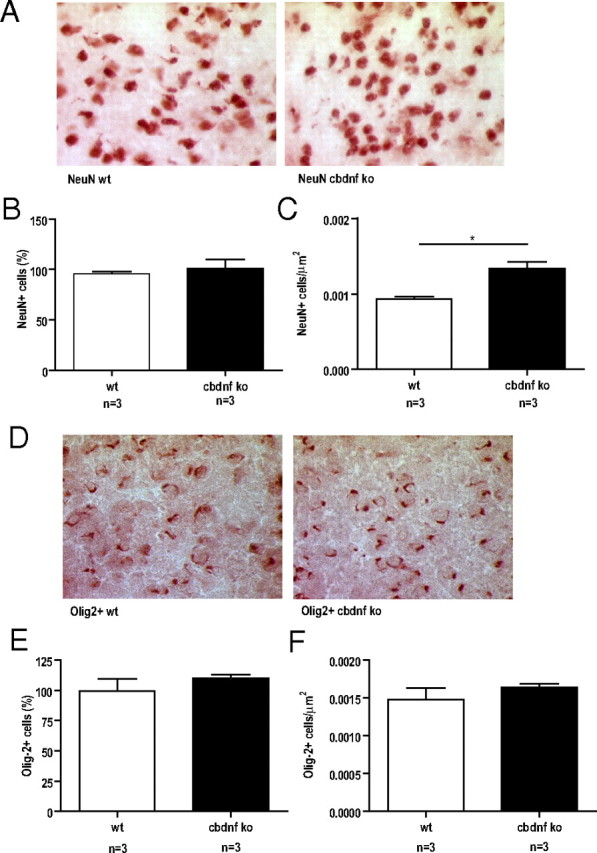
Figure 4.

Number and density of neurons and oligodendrocytes in the striatum of 2-month-old mice. Representative images of the striatum of wild-type and cbdnf ko mice immunostained for NeuN (A) and for Olig-2 (D). B, Number of NeuN-positive cells in the striatum of wild-type and cbdnf ko mice. No significant differences were detected between the genotypes. C, Neuronal density in the striatum is higher in cbdnf ko mice compared with wild-type animals. E, Number of Olig-2-positive cells in the striatum of wild-type and cbdnf ko mice. No significant differences were detected between the genotypes. F, Oligodendrocyte density in the striatum of cbdnf ko mice compared with wild-type animals was not significantly different. All results are presented as a mean ± SEM determined from the analysis of n mice per genotype (*p < 0.05, unpaired t test). The white bars represent wild type, and the black bars represent cbdnf ko mice.
