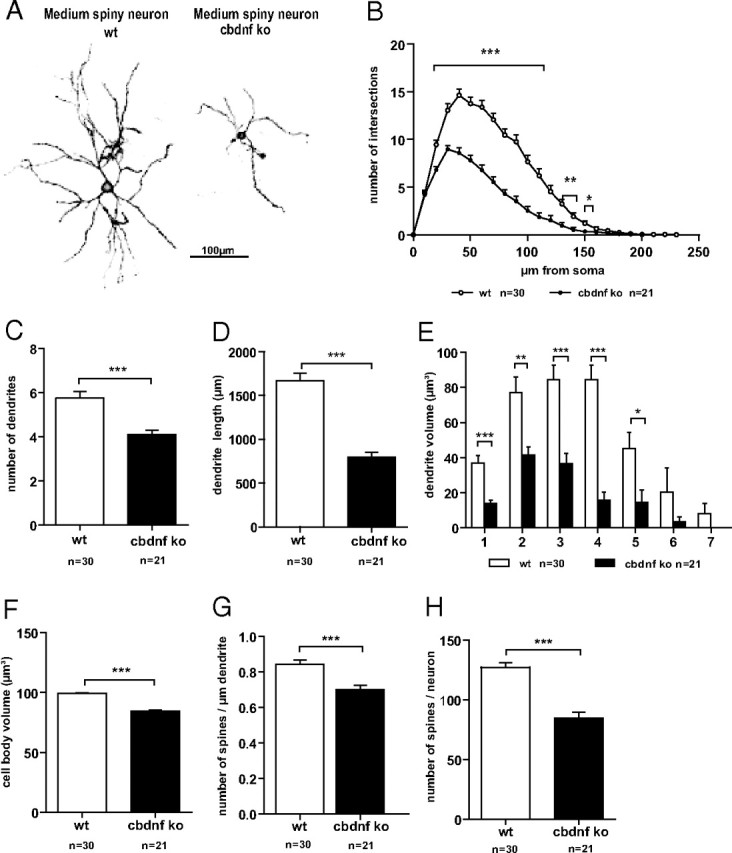
Figure 6.

Dendritic morphology of striatal neurons from wild-type and cbdnf ko animals. Confocal image consisting of stacks of multiple optical sections showing the morphology of wild-type and cbdnf ko striatal neurons (A). Note the smaller size of striatal neurons in cbdnf ko mice. B, Sholl analysis comparing dendritic complexity in wild-type and cbdnf ko striatal neurons. Total number of dendrites (C), total dendritic length (D), total volume of the dendrites within the different branch orders (E), total cell body volume (F), spine density (G), and total number of spines per neuron (H) in wild-type and cbdnf ko striatal neurons. All results are presented as mean ± SEM determined from the analysis of n striatal neurons per genotype (*p < 0.05, **p < 0.01, and ***p < 0.001; Student's t test). Scale bar, 100 μm. The open circles/bars represent wild type, and the black circles/bars represent cbdnf ko striatal neurons.
