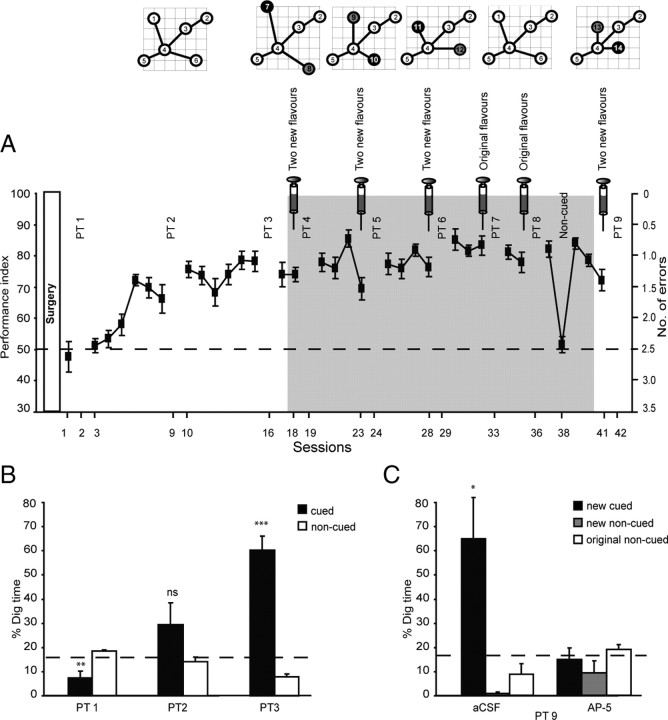
Figure 2.
Acquisition of the schema, new paired associates, and NMDA dependency. A, Performance index of acquisition of the original six paired associates (sessions 1–17; white background). Single days of training of new paired associates alternated with 3 d of the original schema (sessions 18–42; gray background). Performance rose to a stable level of 80% with minimal variability. Note that performance fell to chance on session 38 when the start-box flavor cues were absent. B, Three cued-recall probe trials for the acquisition of the original schema. The graph represents percentage of dig time at the cued location (black bars) relative to that at the noncued locations (white bars). C, Hippocampal NMDA receptor dependence of the acquisition of the new paired associates. The graph represents percentage dig time at the new cued location (black bars) and the new noncued location (gray bars), as well as the average of the four original paired associates (white bars) for probe test 9 in the control (aCSF) and drug (AP-5) conditions. ns, Nonsignificant. *p < 0.05; **p < 0.01; ***p < 0.001 for t tests comparing the proportion of digging for the cued paired associates relative to chance level of 16.7%.

