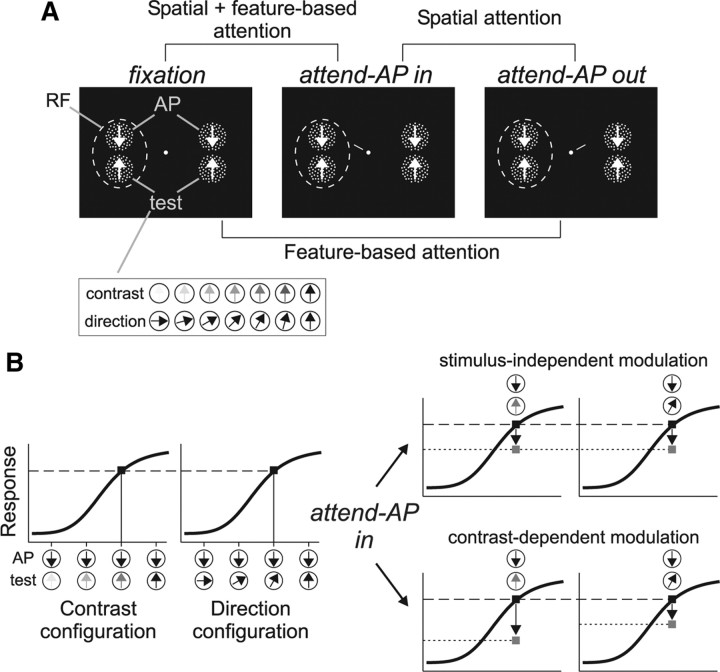
Figure 1.
Task design. A, Stimulus display in the three behavioral conditions and the different comparisons. Each panel shows two pairs of high-contrast RDPs presented inside and outside the RF (dashed circle), and moving in the neuron's antipreferred (AP pattern) and preferred (test pattern) direction. Insert at the bottom illustrate the different contrasts and motion directions of the test pattern. B, The graphs on the left illustrate hypothetical response profiles of an MT direction-selective neuron as a function of changes in contrast or motion direction of the test pattern (illustrated on the abscissa). Black squares mark similar response levels evoked by different stimuli. The graphs on the right illustrate the predictions of the stimulus-independent and contrast-dependent modulation when attention is shifted from the AP pattern outside the RF to a similar pattern inside (arrows and gray squares) (see Materials and Methods for details).

