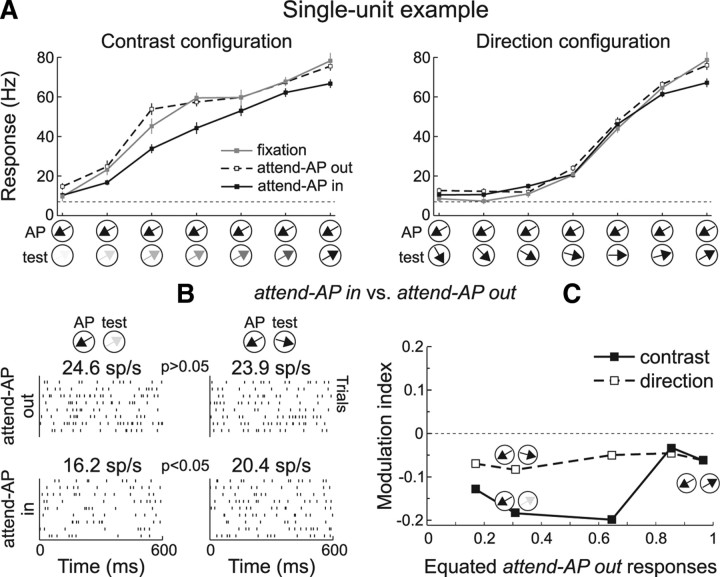
Figure 3.
Attentional modulation of equated responses: single-unit example. A, Average responses to different combinations of AP and test-pattern contrasts (left) and directions (right) in the “fixation” (gray), “attend-AP in” (black), and “attend-AP out” (dashed) conditions. The stimuli are illustrated along the abscissa. The dashed horizontal line indicates spontaneous response without stimulus. The neuron's preferred direction was 60° clockwise from vertical. Error bars, SEM. B, Raster plots of the neuron's activity, and mean firing rates during trials with different stimulus pairs, in the “attend-AP out” (top) and “attend-AP in” (bottom) conditions. The p value indicates the significance level (U test) of differences between responses evoked by different stimuli. C, MI across responses equated during the “attend-AP out” trials. Black squares and solid line, MI for responses to stimuli of the contrast configuration. Open squares and dashed line, MI for responses to stimuli of the direction configuration.

