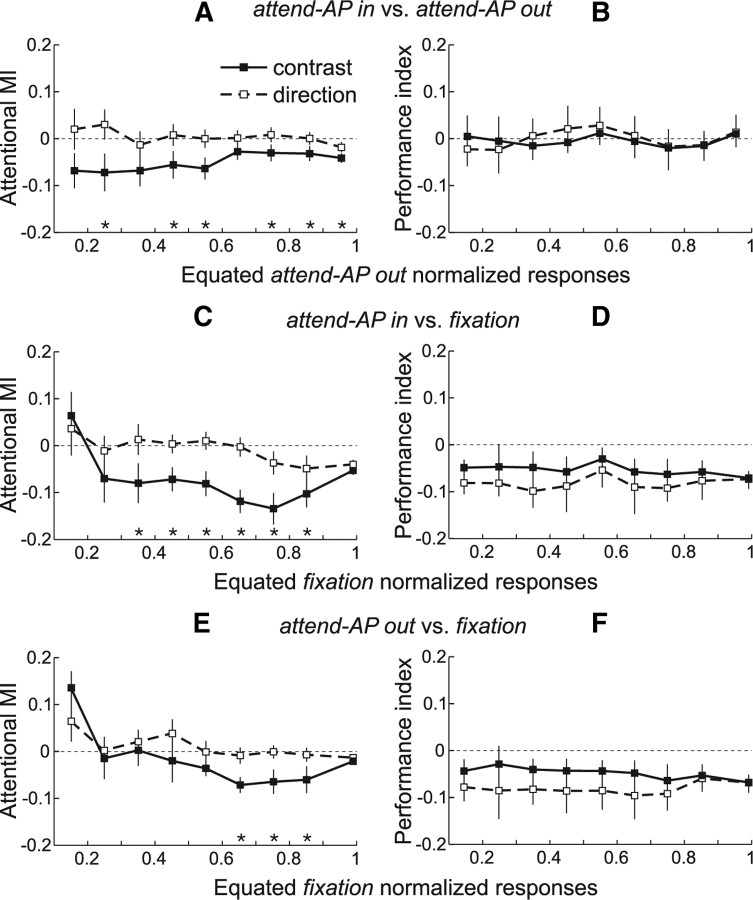
Figure 4.
Attentional modulation of equated responses: population analysis. A, Averaged population MIs between “attend-AP in” and “attend-AP out” trials across response levels equated during the “attend-AP out” condition. Error bars, SEM. Stars denote equated response levels with significant differences in MI between trials of the contrast (black squares) and direction (open squares) configuration. Note that in the population, the number of equated responses varied from cell to cell, and therefore the number of cells contributing to each response level also varied. B, Averaged performance indices (perfMI) between “attend-AP in” and “attend-AP out” trials that contributed to each equated “attend-AP out” response level. Error bars, 95% confidence intervals (computed through a bootstrap procedure). C, E, Averaged population MIs between “attend-AP in” and “fixation” (C) and between “attend-AP out” and “fixation” trials (E) across responses equated during the “fixation” condition. D, F, Averaged performance indices between “fixation” trials and “attend-AP in” (D) or “attend-AP out” trials (F) that contributed to each equated “fixation” response level.

