Figure 4.
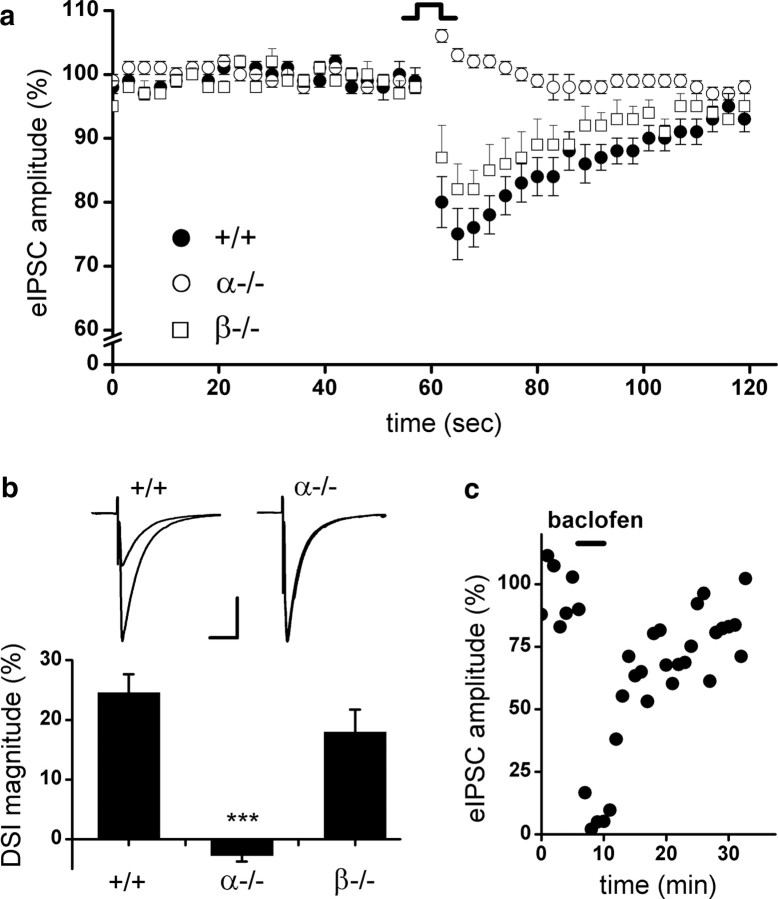
DSI in the hippocampus of wt, DAGLα−/−, and DAGLβ−/− mice. a, DSI is absent in DAGLα−/− mice. Average time course for eIPSC amplitudes after depolarization in wt (+/+), DAGLα−/− (α−/−), and DAGLβ−/− (β−/−) mice. DSI for each genotype is averaged across all cells sampled, four to five DSI protocol repeats per sampled cell (+/+, n = 35; α−/−, n = 21; β−/−, n = 21). b, Peak DSI value is expressed as a percentage of depression in eIPSC amplitude after depolarization. Insets are representative recordings from a single CA1 neuron in wt (+/+), DAGLα−/− (α−/−), and DAGLβ−/− (β−/−) mice: the average of eIPSC traces (n = 4–5) just before DSI versus the average of eIPSC traces at the peak of DSI (second trace after 5 s depolarization; n = 4–5). Scale bar, 50 ms, 400 pA. *** p < .001, one-way ANOVA. Error bars indicate SEM. c, (RS)-Baclofen (10 μm) displays a robust inhibition of eIPSC in DAGLα−/− mice, as indicating here the eIPSC recordings of a single CA1 neuron in a representative experiment; each point represents the average of six eIPSCs.

