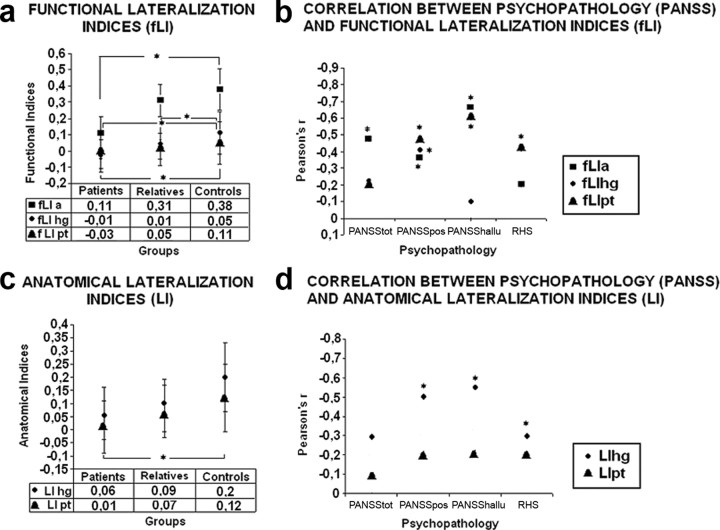
Figure 4.
Functional and anatomical lateralization indices for the different groups and results of correlation analyses with the PANSS and RHS scores. Asterisks denote significant group differences (a, c) or correlations (b, d) (p < 0.05; Bonferroni corrected). a, Group differences of fLI for the whole auditory cortex (fLIa) (squares), HG (fLIhg) (circles), and PT (fLIpt) (triangles). b, Correlations of fLIs with the total PANSS score (PANSStot) and positive (PANSSpos) and hallucination (PANSShallu) subscores and the scores on the Revised Hallucination Scale (RHS). c, Group differences of LI for HG (LIhg) (circles) and PT (LIpt) (triangles). d, Correlations of LI values with the symptom scores (see b).

