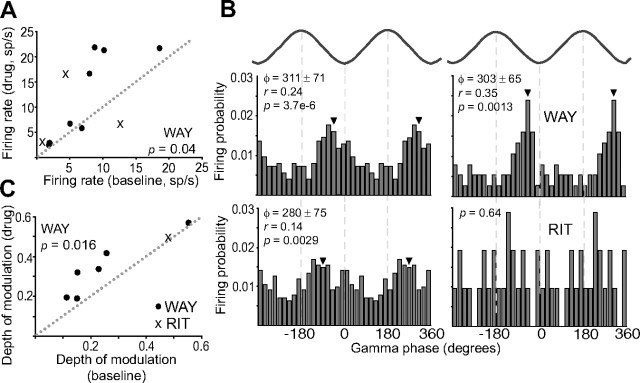
Figure 6.
Effects of 5-HT1AR and 5-HT2A/2CR antagonists on FSi activity and synchronization to gamma waves. A, Scatter plot of firing rates before and after injection of WAY (filled circles) and RIT (crosses). Firing rates were measured from UP states detected in 1 min segments. B, Examples of the effects of WAY and RIT on the coupling of two distinct FSi to gamma waves. Shown are firing probability distributions around gamma troughs before and after drug injection. Two gamma cycles are shown for clarity. Top, WAY did not change the preferred firing phase (Φ; marked with an arrowhead), but increased the depth of the modulation (r), “sharpening” the distribution. Bottom, RIT uncoupled this unit to gamma waves (p > 0.05). p values are from the Rayleigh Test. Bin = 20°. C, Scatter plot of the depth of modulation to gamma waves before and after the administration of WAY (filled circles) or RIT (crosses). RIT uncoupled 2 of the 3 units tested, for which a depth of modulation could not be computed.

