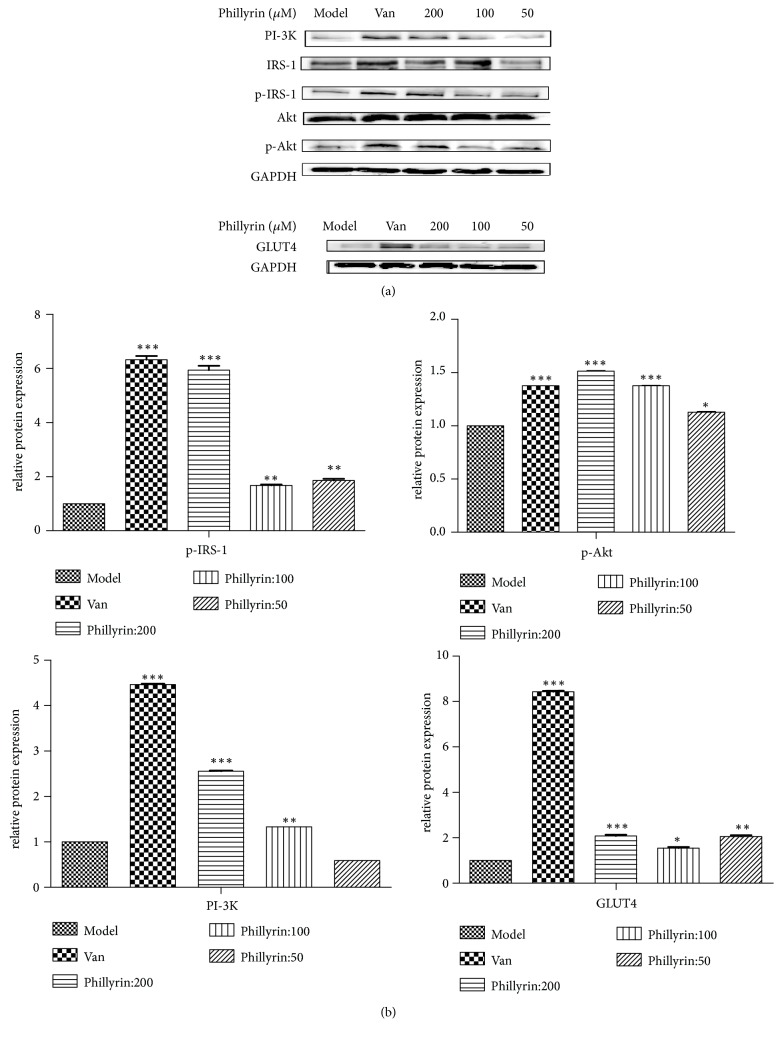
Figure 3.
Western blot analysis of protein expression. (a) Effects of phillyrin on protein expression levels of PI-3K, IRS-1, p-IRS-1, Akt, p-Akt, GAPDH, and GLUT4 in IR 3T3-L1 adipocytes. (b) Gray value analysis of corresponding protein. Data are presented as means ± SD, n = 6. The experiments were repeated three times. ∗∗∗P < 0.001, ∗∗P < 0.1, and ∗P < 0.5 versus model group.

